In this report: WTI’s down into a visible glut with weak OECD demand, so we stay cautious on flat price and express the view via long back-end spreads.
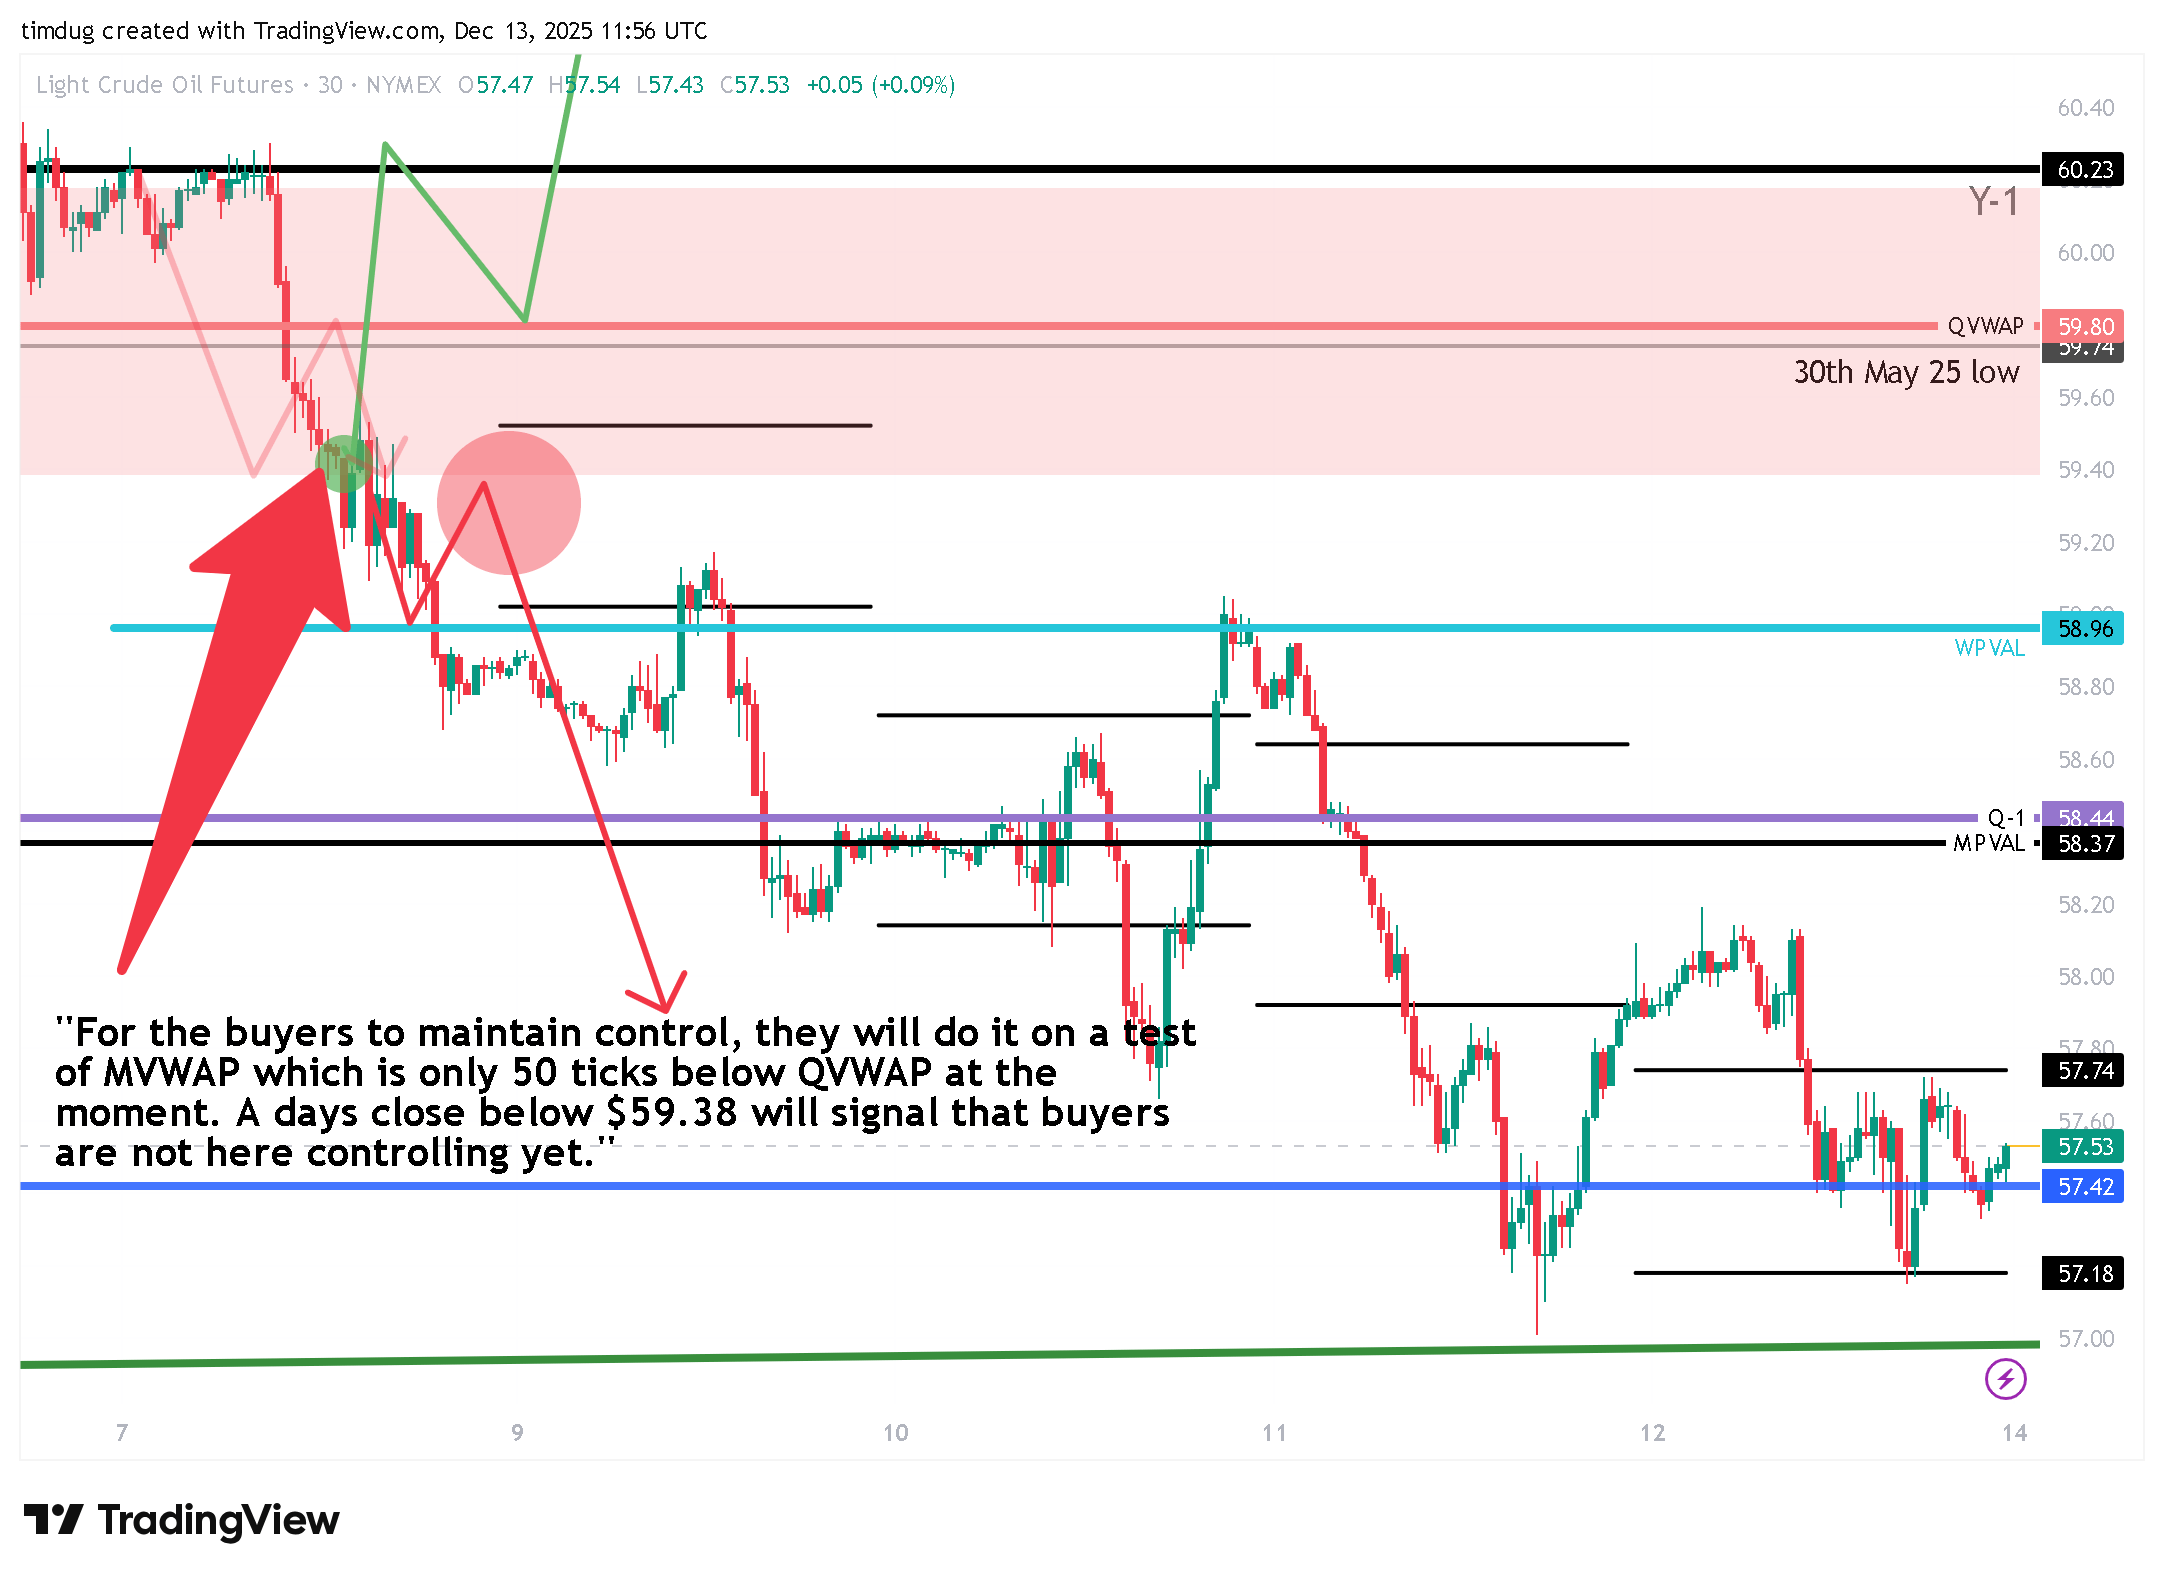
Key Stats. WTI -4.39% (-$2.64) for the week. Open $60.15 High $60.30 Low $57.01 Close $57.44
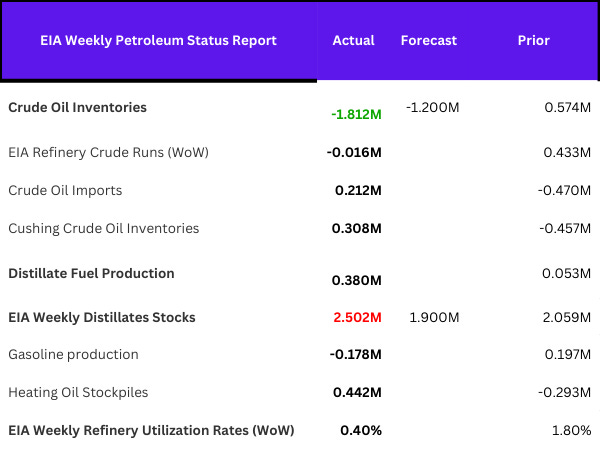
Review of last weeks guidance
Articles
Oil Market Faces ‘Super Glut’ With Supply Hikes, Trafigura Says
Video: Trafigura 2025 Market Review with Chief Economist Saad Rahim
Europe should prepare for war ‘like our grandparents endured’, warns Nato chief
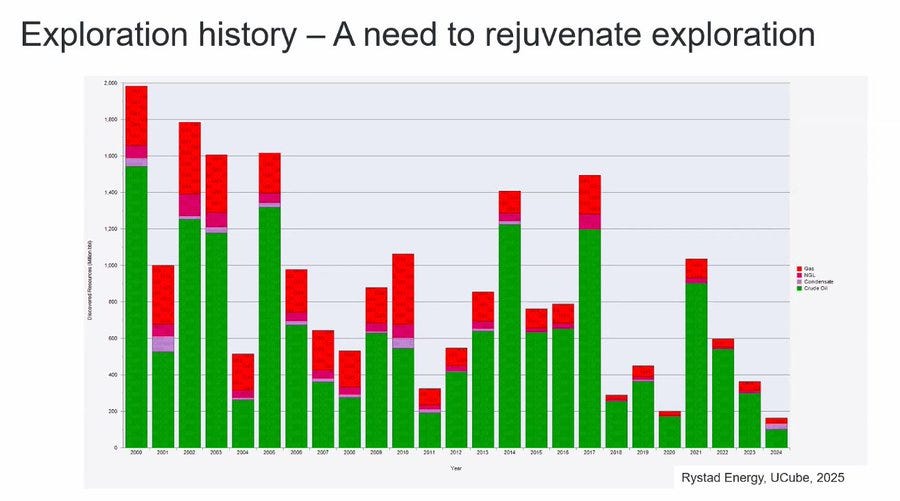
The shrinking discovery curve: why exploration still matters
Countries with Declining Population 2025
UN WORLD POPULATION PROJECTIONS: 21ST CENTURY POPULATION DECLINE
Thanks as always to my partners in Newsqawk- The best in the business. Paid subscribers to The Oil Report get a deep discount on Newsquawk products. Get in touch for access.


View
The market is finally starting to realise that Glut or no Glut, you don’t want to be a turkey at Christmas. In simple terms, you don’t want to be long while there is so much supply in the face of hard data of builds globally. The demand picture is the Global Western hemisphere is also done for. Don’t take my word for it- here is what the Trafigura Chief Economist said-
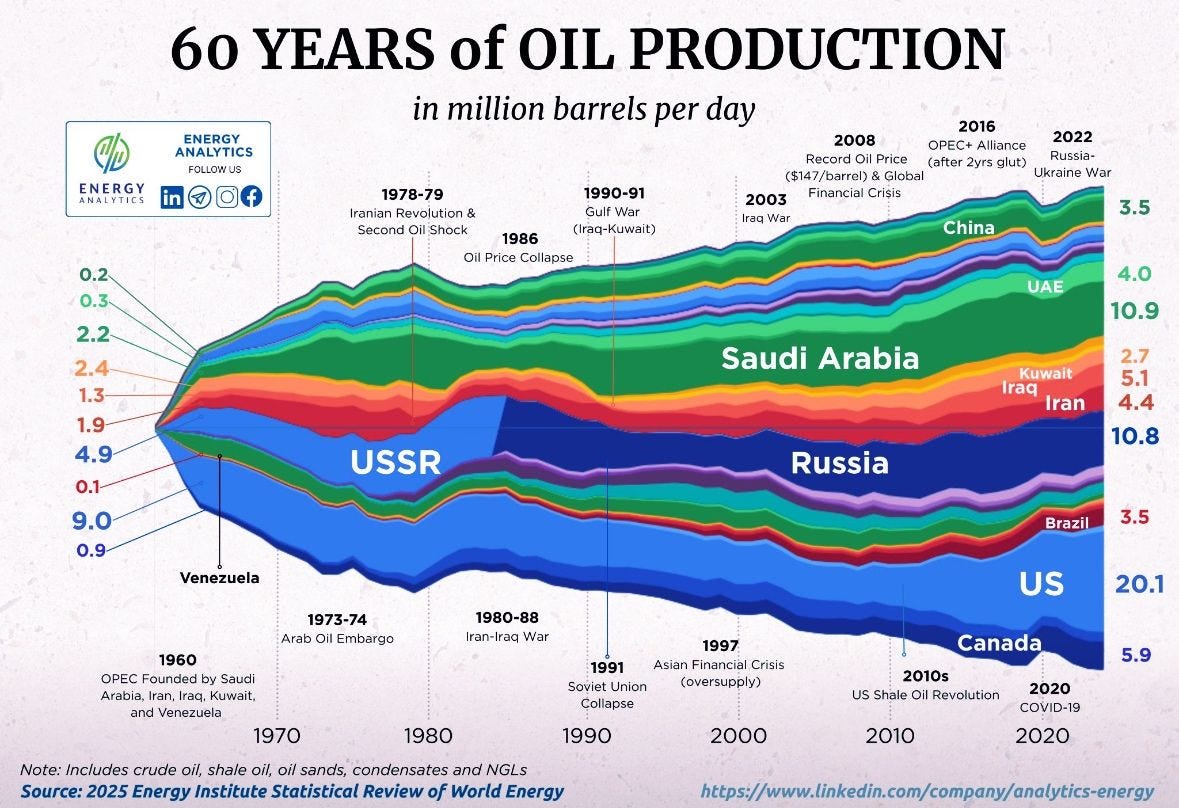
That drove oil markets certainly for a while…then the third one emerging markets really to me, you know, I think has been the bright spot where we’ve seen continued growth; and that’s offset some of the uncertainty elsewhere. And I think that continues to be a big theme for commodity markets not just this year but every year going forward. -Saad Rahim- Trafigura Chief Economist.
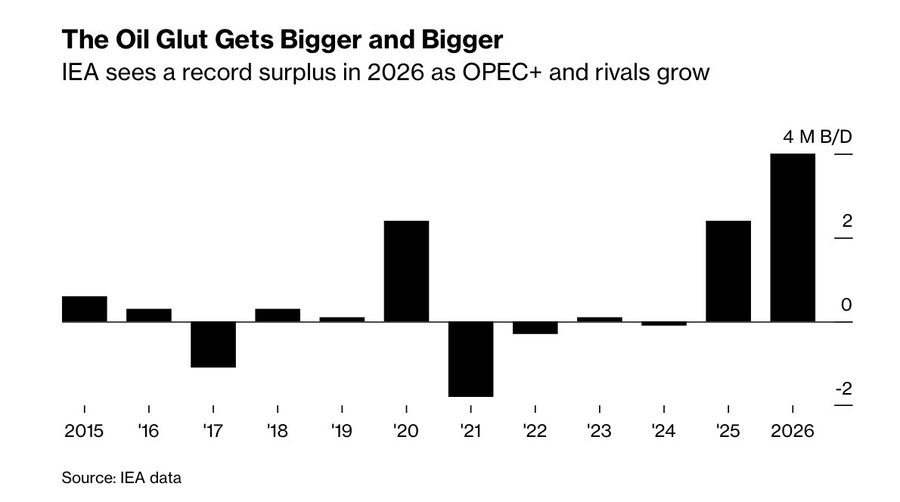
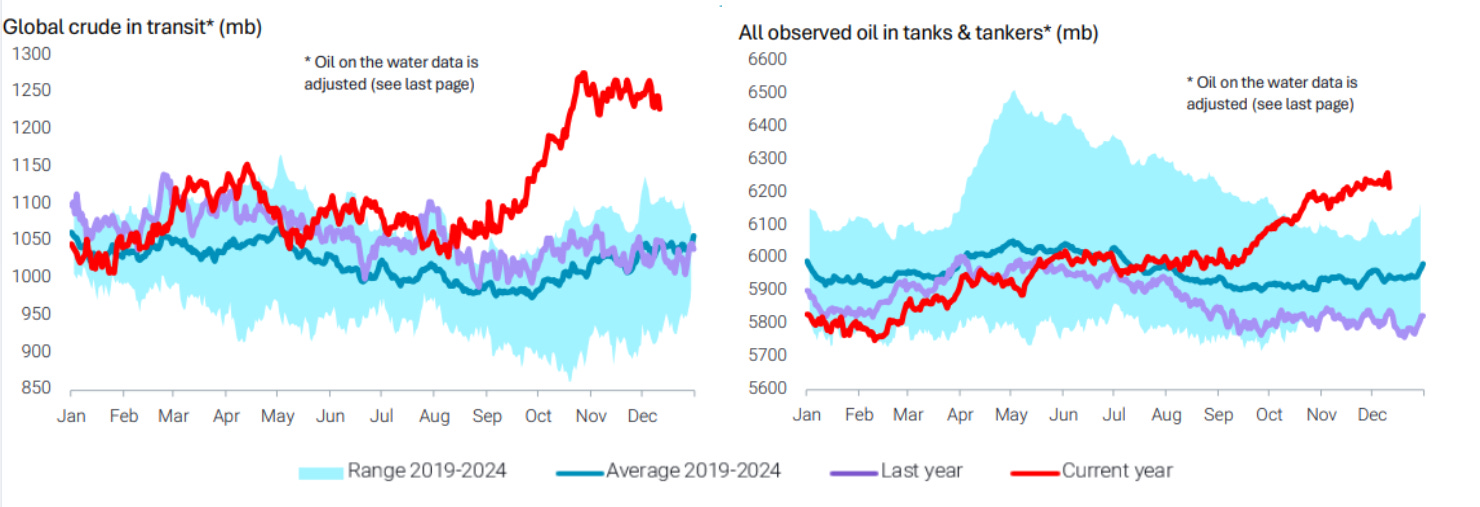
We are now starting to see the rise of The Glut stutter and consolidate at current levels. Enhanced Russian seaborne activity sanctions may reaccelerate the glut. But for now, we are starting to see the signs that the glut is going into storage.
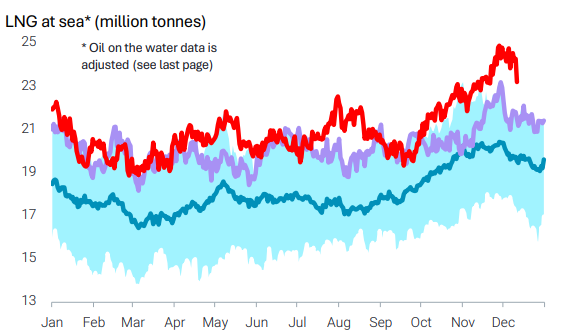
Now that the clod snap for North America is priced in (last week) and priced out (this week), we can see an acute change in LNG at sea coming into land. And Nat Gas prices this week at Henry Hub tell that story.
Make oil exploration great again
My dad was a senior driller in oil exploration for fifty years. He was on a rig right up until the last three months of his life. He spent those decades bouncing around the world, onshore and offshore. In the later years he specialised in deepwater – high-pressure, high-temperature wells, the hard end of the business.

I asked him once, “How much oil is there left out there?”
This is a man who spent half a century looking at seismic and geothermal data from all over – and then going out and drilling it.
He thought for a moment: “About two, maybe three hundred years’ worth.”
The point of that story isn’t that his number is exact. It’s that someone who devoted his life to finding oil did not believe we’re about to run out, or that demand is about to vanish any time soon.
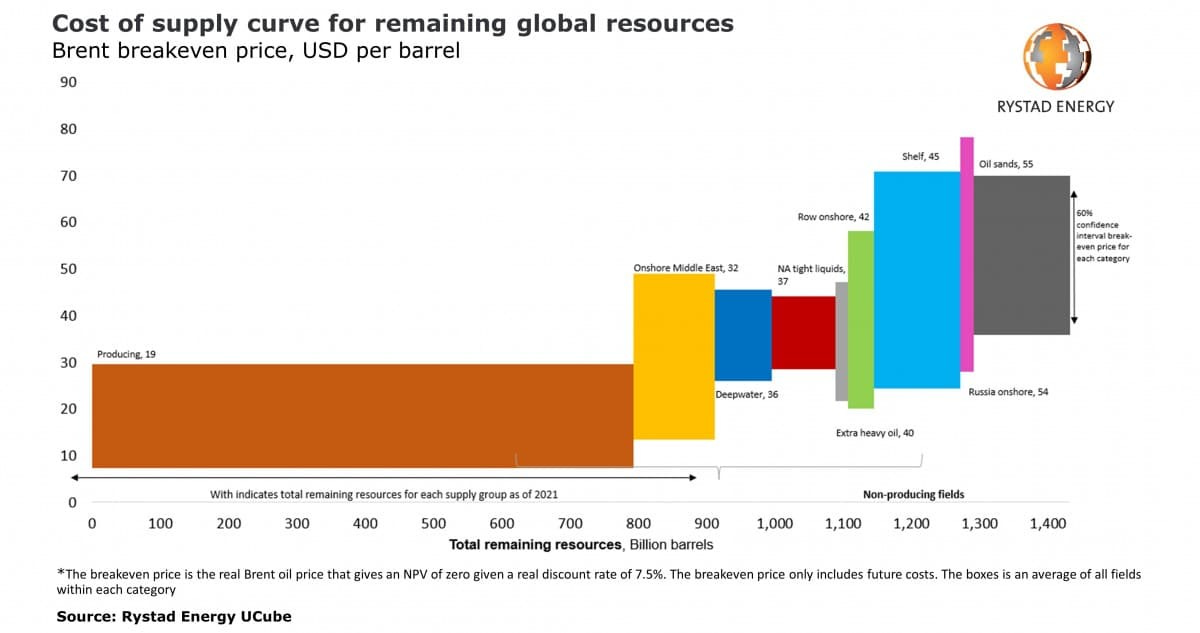
Yes, transportation demand will decline over time. But petrochemical feedstock demand – medicines, plastics, fertilisers, industrial chemicals – doesn’t just disappear. As transport demand rolls over while new barrels increasingly come from deeper, tighter, more complex reservoirs, core demand persists while the barrels themselves get harder and more expensive to produce.
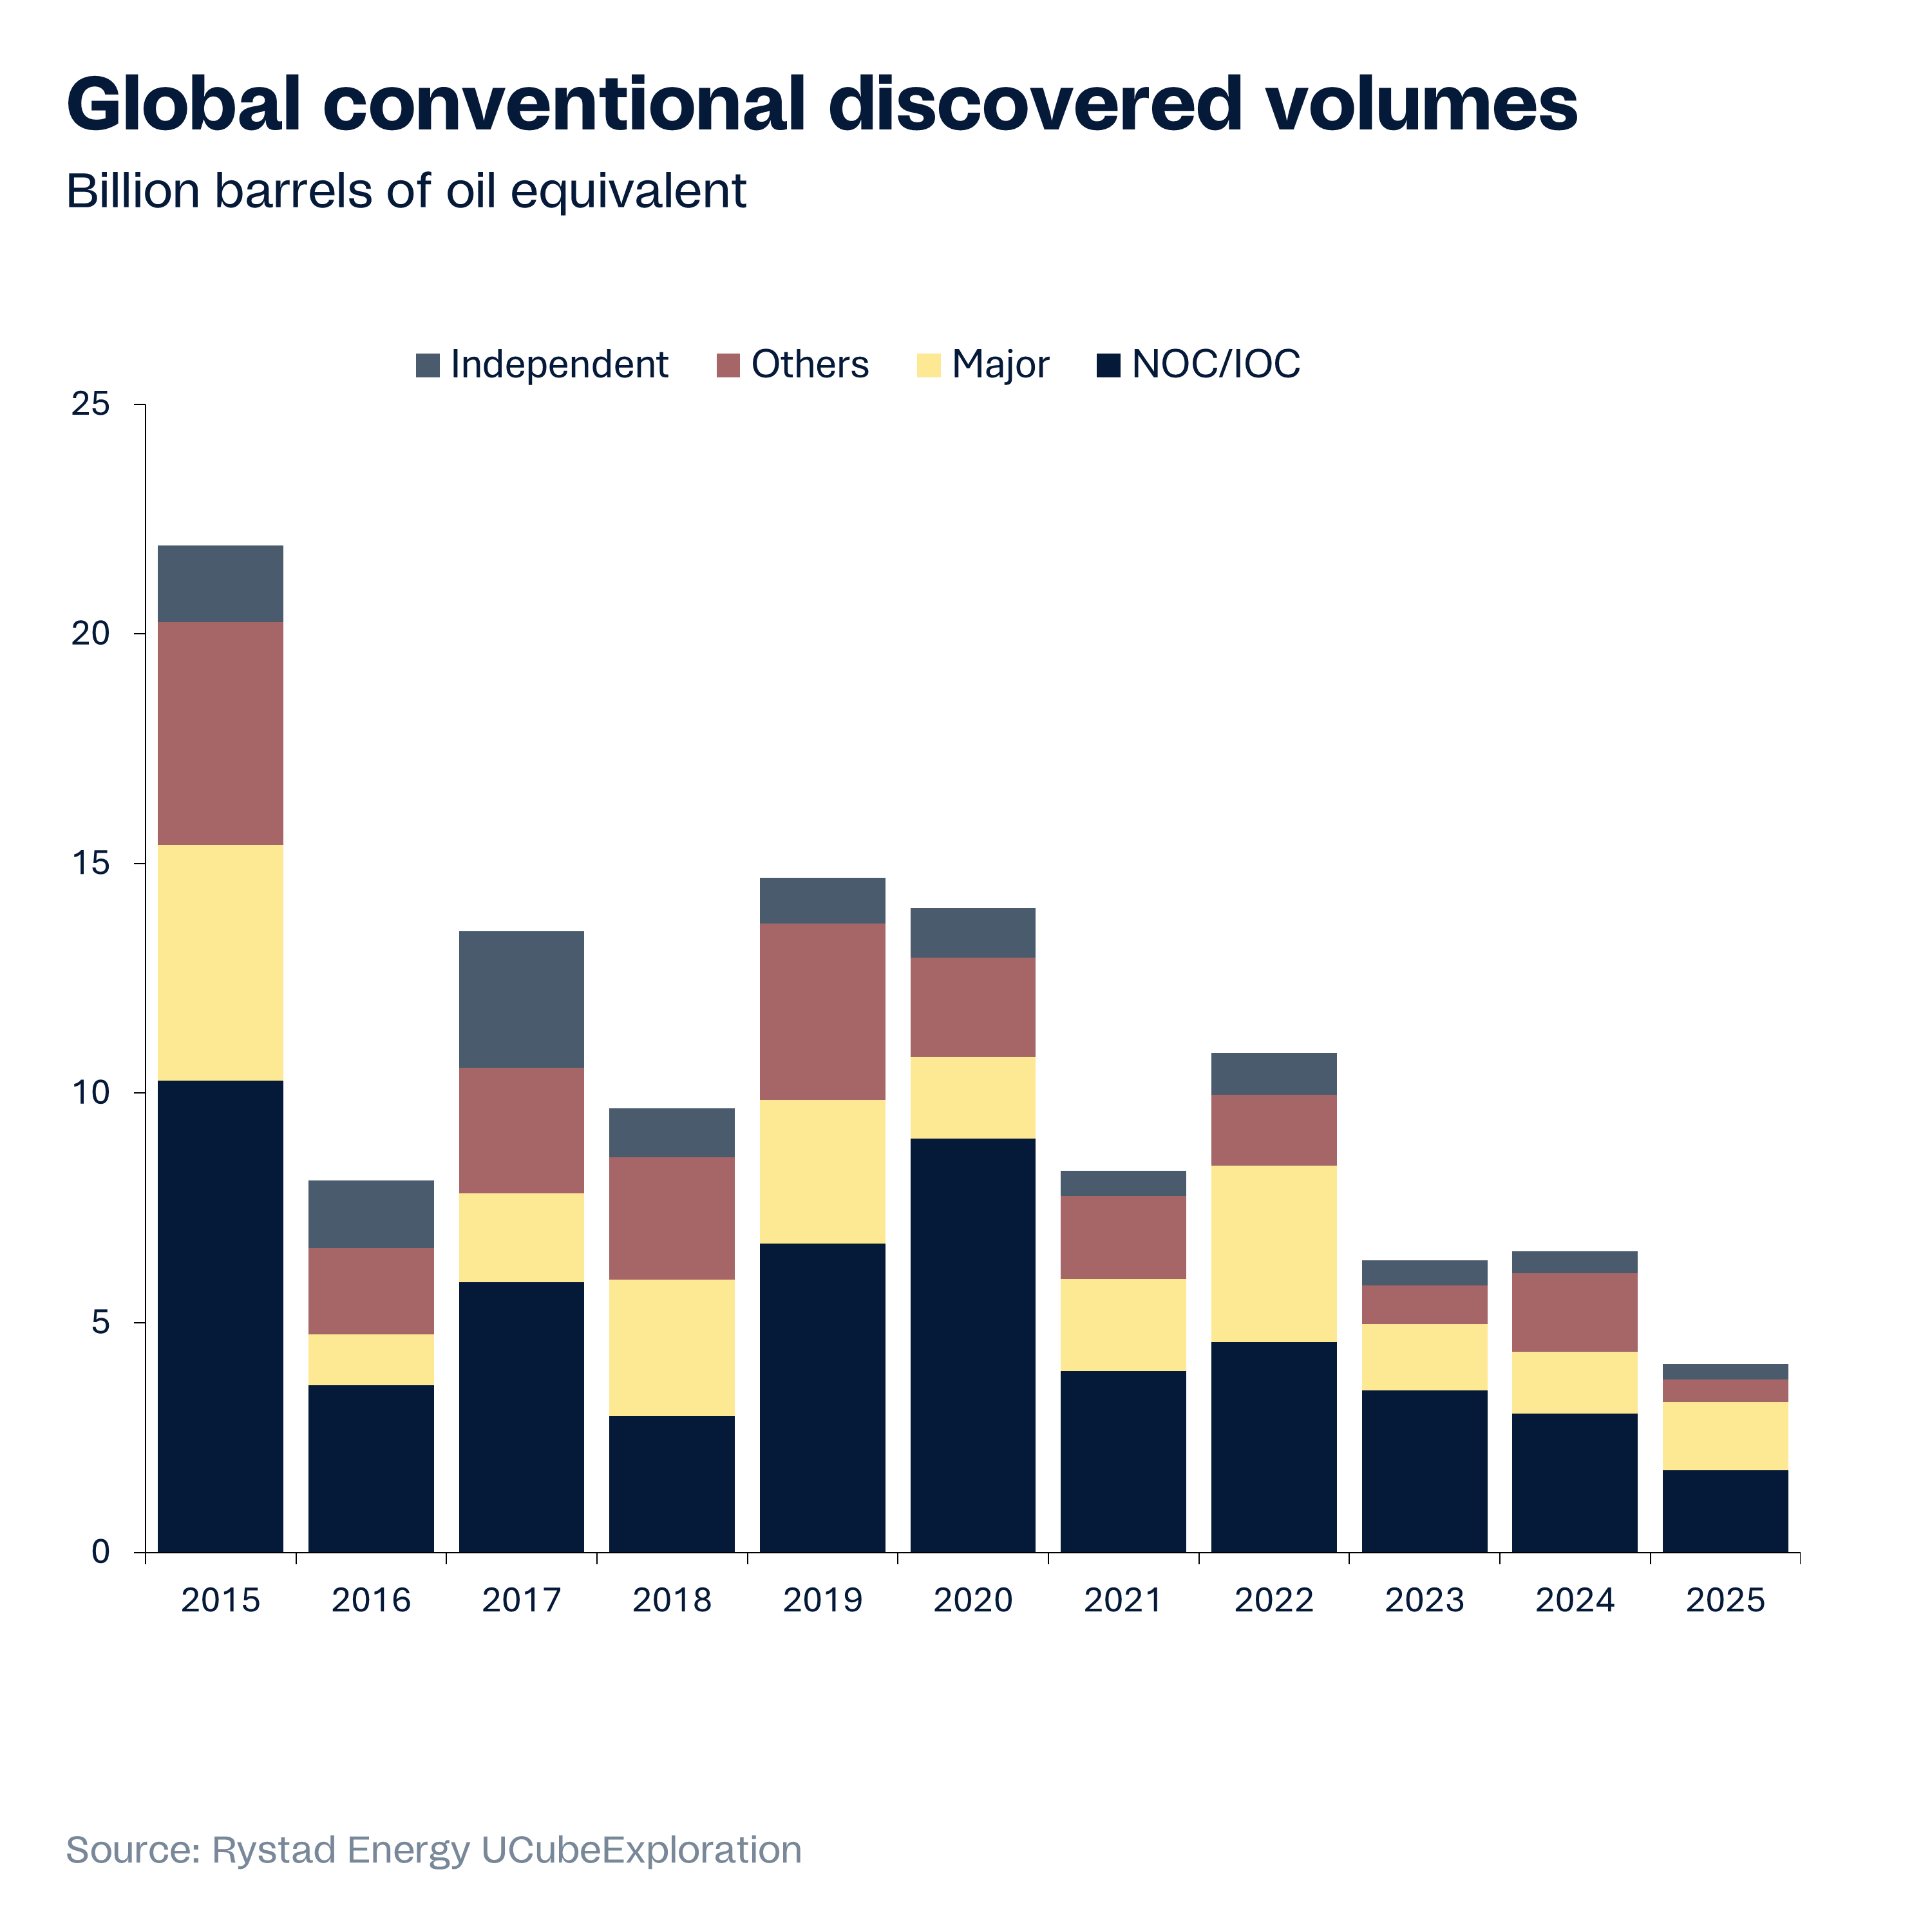
That sets up the next phase. Once we chew through this short- to medium-term glut, the cost of getting a barrel from reservoir to refinery is likely to rise significantly. AI can only help to a certain level. Prices will have to move higher to clear the market and cover structurally more expensive upstream and refining, at least until the industry grinds costs back down.
The implication is simple: petrochemical end products will tend to run ahead of headline inflation, and some high-cost regions will simply be priced out. They’ll rely more heavily on lower-cost producers, deepening the shift of supply – and pricing power – toward the cheapest barrels.
So the long game is simple.
Even if sectoral demand falls – especially in transportation – core demand doesn’t disappear. It just shifts. As that happens, marginal exploration and production operators get squeezed out. The high-cost, high-debt, late-cycle players go first.
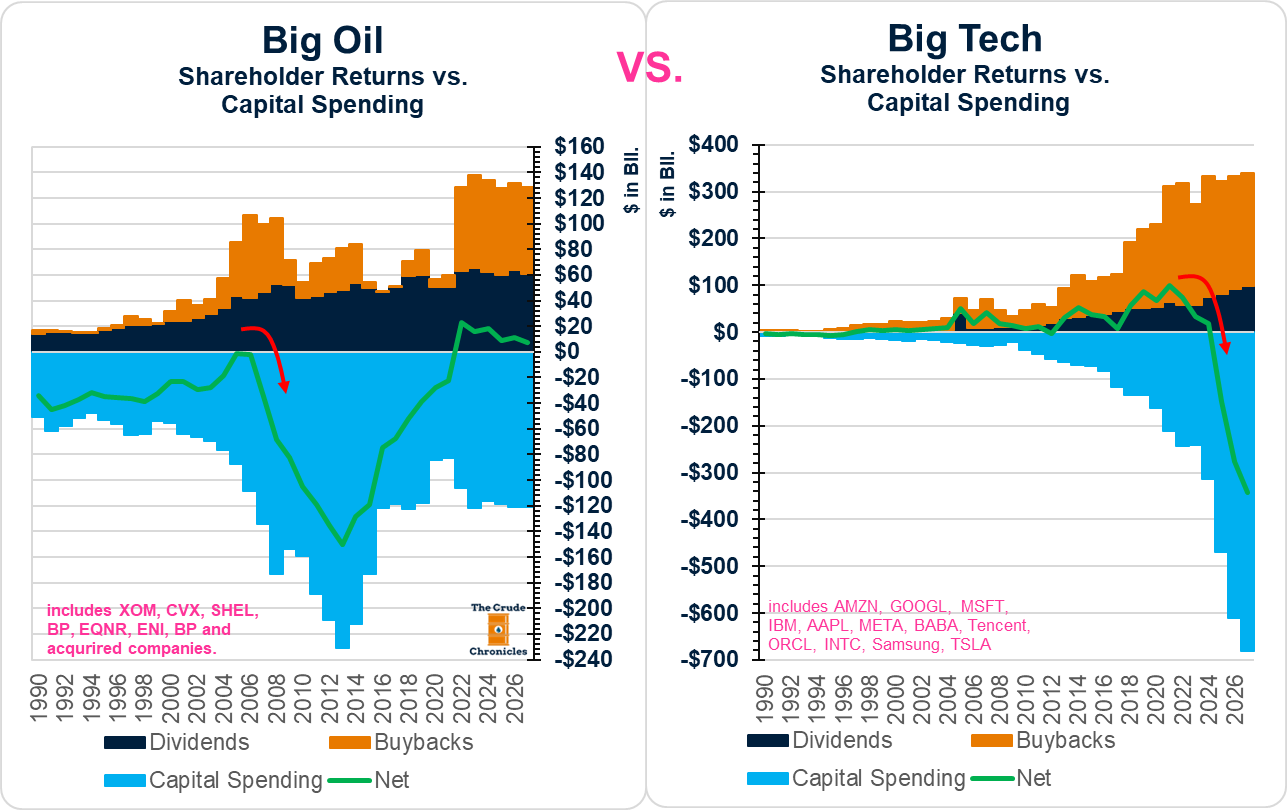
What’s left is a smaller group of operators drilling tighter, deeper, hotter wells. Fewer players, tougher barrels. Those who remain will only invest if they can command a higher premium to cover the rising technical and capital cost of each new barrel. This is your oil to $300 a barrel story. The real risk to this future picture is population decline.
In summary:
The market is finally waking up to the risk of being long into a visible glut: inventories are building, Western demand is fading and, as Trafigura’s Saad Rahim notes, emerging markets are now the only real growth engine. Structurally, though, we’re not “running out” of oil – transport demand may erode, but petrochemical and industrial demand will persist even as new supply comes from deeper, tighter, more expensive reservoirs. That squeezes out marginal E&Ps, concentrates production in a smaller group of operators, and pushes up the full-cycle cost of each new barrel. Once the current glut is cleared, that cost structure – not scarcity – is what sets the stage for a much higher price regime. Petrochemical products running ahead of inflation and an eventual path to eye-watering numbers, even $300/bbl in an extreme squeeze.
Notes From IEA MOR (Monthly Oil Report)
In summary
OECD data are quietly shouting “looser, not tighter”: production is growing about six times faster than product demand, with almost all the incremental consumption coming from the Americas while Europe flatlines and Asia-Oceania shrinks. The demand mix is narrow – jets and LPG up mid-single to high-single digits, diesel and fuel oil flat to negative – which screams travel/petchem strength against soggy freight and industry. Inventories are edging higher year-on-year, and the extra barrels are sitting in the Atlantic Basin (Americas + Europe), undercutting any “global shortage” story even as regional dislocations and spreads still matter. Here are the stats details as below.
Supply outrunning demand (by a wide margin)
OECD indigenous crude/NGL/feedstock production in September was up 6.3% y/y and +2.2% year-to-date.
OECD net consumption of total products (your demand proxy) was only +1.0% y/y in September and +0.6% YTD.
→ Supply growth is roughly 6x demand growth on the month – a structurally looser OECD backdrop unless non-OECD soaks it up.
The Americas are the only real demand engine
OECD Americas total product net deliveries: +1.7% y/y in September, +1.7% YTD.
OECD Europe: +0.2% y/y, but -0.1% YTD.
OECD Asia Oceania: +0.5% y/y, but -2.0% YTD.
→ Almost all incremental OECD demand this year comes from the Americas; Europe is treading water and Asia is a drag.
Demand growth is narrow: jets and LPG vs dead diesel
For Total OECD year-to-date vs 2024:LPG: +7.1%
Total kerosene (jet/other): +2.6%
Total gasoline: basically flat (+0.1%)
Gas/diesel oil: -0.2%
Residual fuel oil: -3.8%
→ Growth is planes + petchem; freight/industry barrels are flat to negative.
Stocks drifting higher – and the builds are in the West
OECD total oil stocks on national territory rose 1.349 Mt m/m in September to 472.2 Mt, and are about +4.8 Mt y/y vs September 2024 (roughly +1%).
By region, Sep-on-Sep total oil stocks: Americas +4.3 Mt (~+2.3%), Europe +1.8 Mt (~+1.0%), Asia Oceania –1.3 Mt (~-1.3%).
→ The marginal barrel is sitting in the Atlantic Basin, not Asia – helpful for Asian diffs, less friendly for Atlantic cracks.
Distillate picture: OECD comfortable, US rebuilt from mid-year dip
Total OECD middle distillate stocks: 206.5 Mt → 210.2 Mt between Sep-24 and Sep-25 (about +1.7% y/y).
US middle distillate stocks dipped to 18.3 Mt in 2Q25 but recovered to 20.4 Mt in 3Q25 (around +11% q/q and now slightly above Sep-24).
→ The “disty crisis” narrative doesn’t show up in OECD tanks right now – but the speed of the US rebuild is a good reminder that refiners can respond when cracks scream loud enough.
Source: The Crude Chronicles x.com