In this report: Stretched high prices and specs at it again, but is there structural risk? Looking at the Oman/Dubai spread.
Key Stats. WTI +5.71% (+$3.59) for the week. Open $63.30 High $67.03 Low $61.87 Close $66.48

Articles
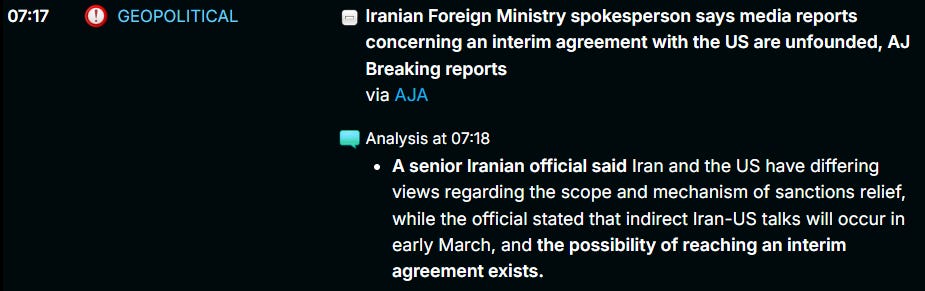
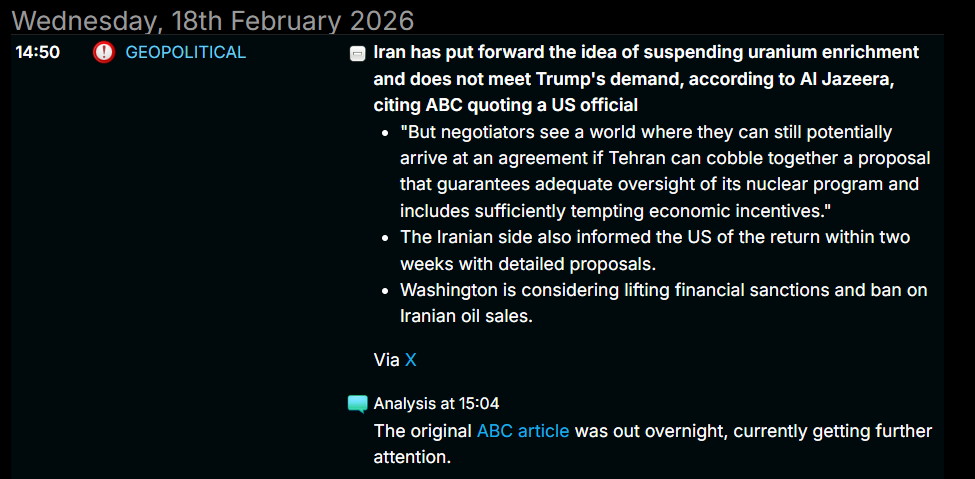
Iran hails ‘encouraging signals’ from US before nuclear talks on Thursday
EIA: US Crude Oil Inventories Slump As Demand Rises
Monday 23rd Feb 2026
View
Two key things as we look to how risk is getting priced.
1: Structural pricing
2: Mean reversion
Structural pricing
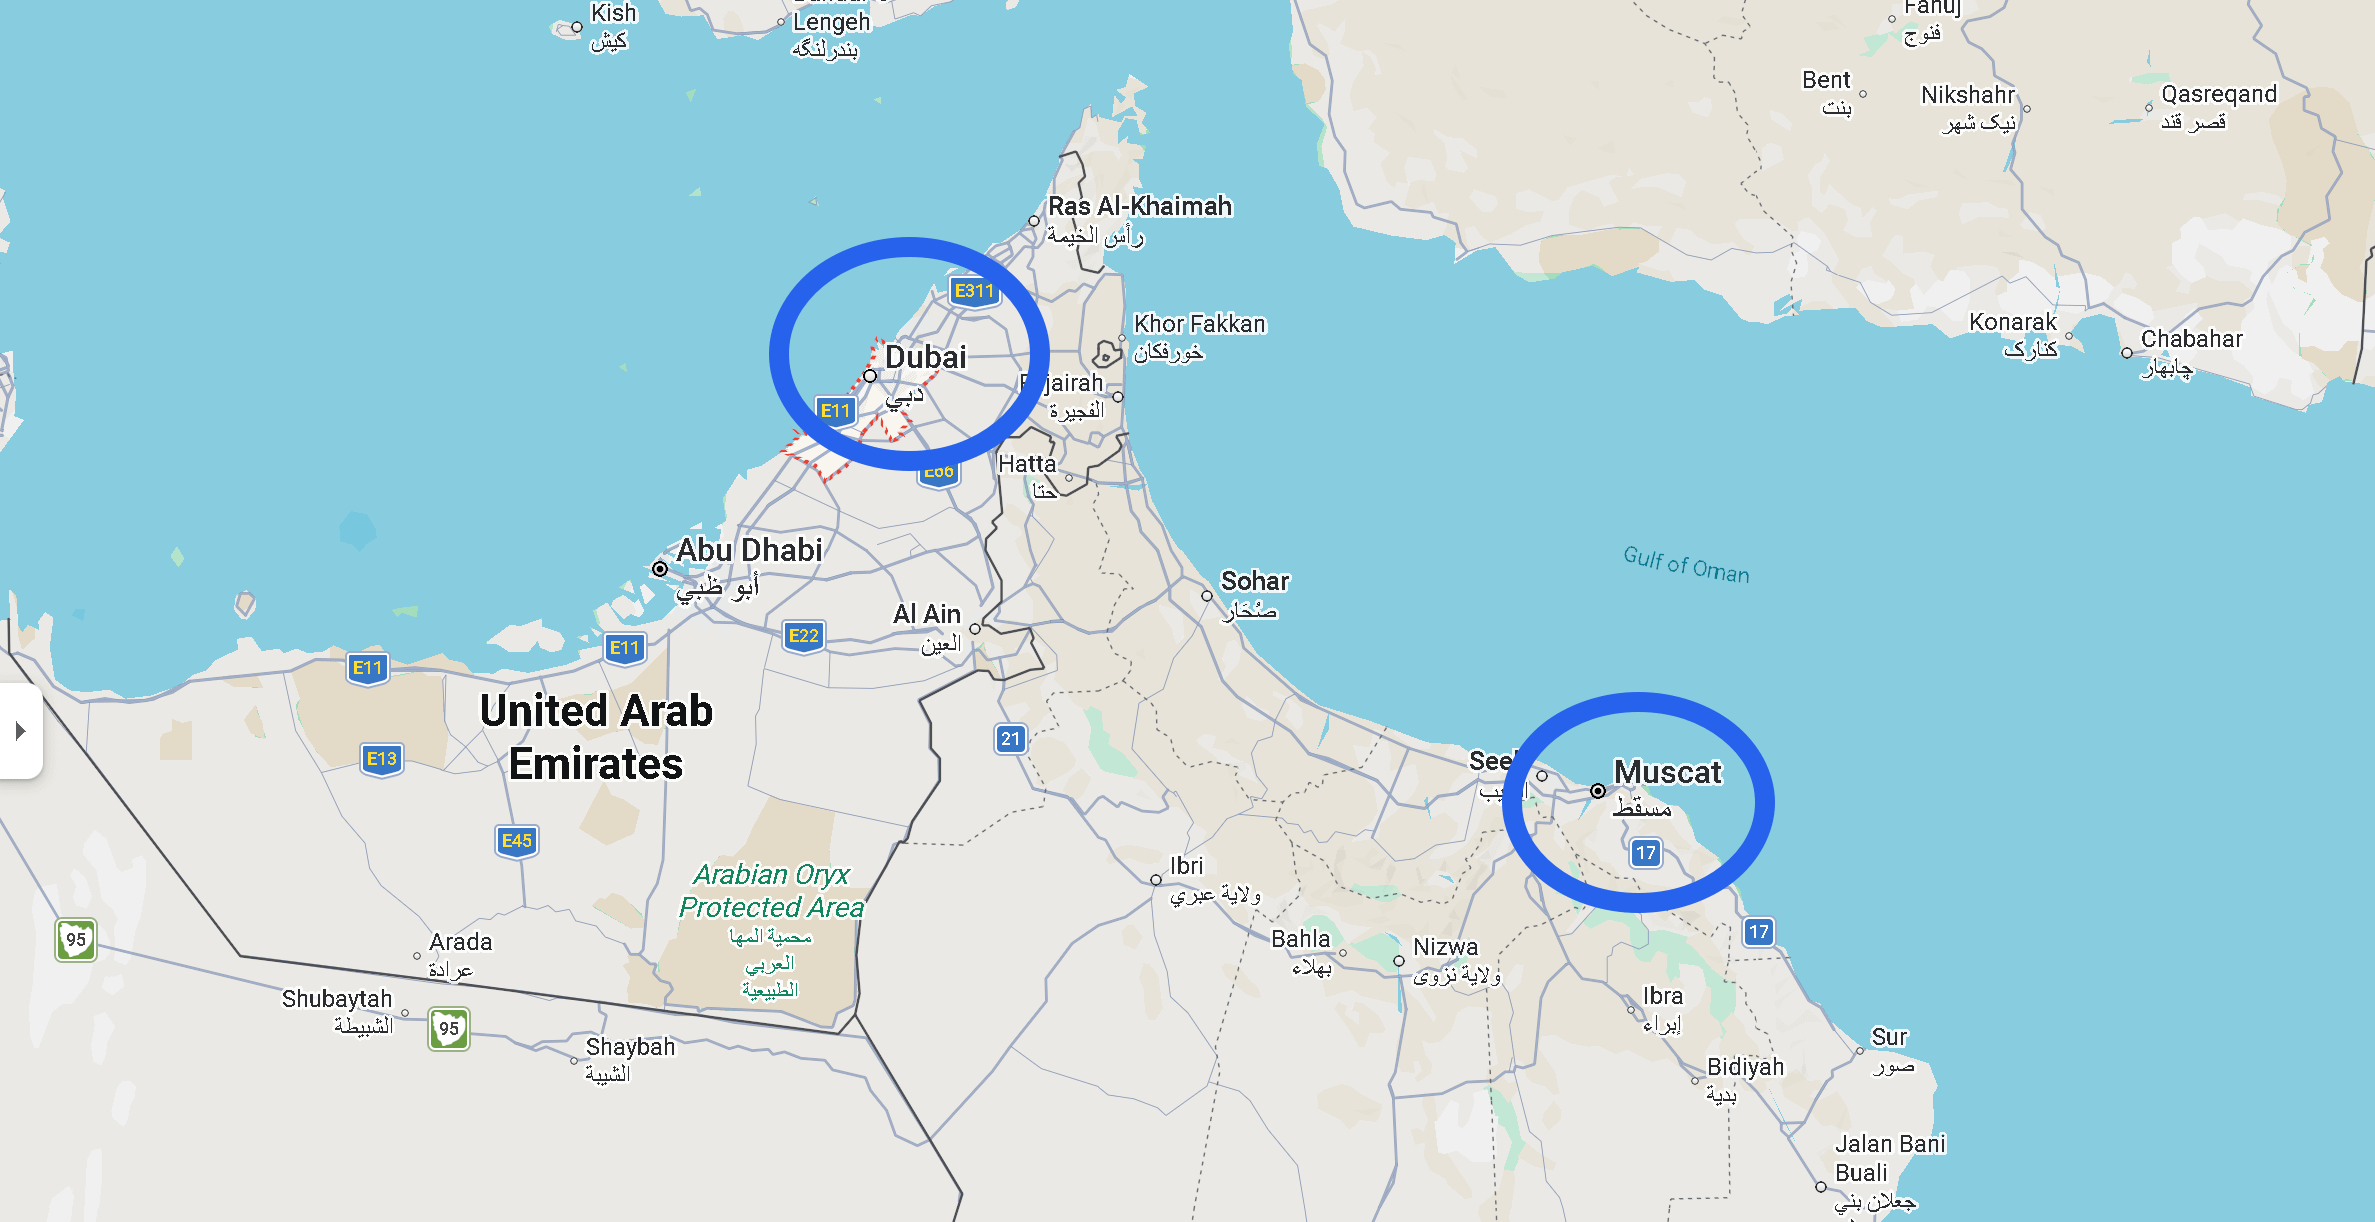
The Dubai–Oman spread matters because it isolates geographic risk within the Middle East crude complex. Dubai crude represents barrels loaded inside the Persian Gulf that must transit the Strait of Hormuz; Oman loads outside the Strait and avoids that choke point. In normal conditions, the spread trades in a relatively tight range, driven by refinery demand and quality differences. But in periods of credible disruption risk, the relationship can dislocate sharply. Oman strengthens as refiners pay up for logistical security, while Dubai weakens as buyers discount transit exposure. A sustained widening signals that the market is pricing physical vulnerability, not just headlines. Conversely, if the spread barely moves during geopolitical escalation, it suggests traders believe flows will continue uninterrupted. In short, the Dubai–Oman spread is not just a relative value trade. This is how it looks at the moment.
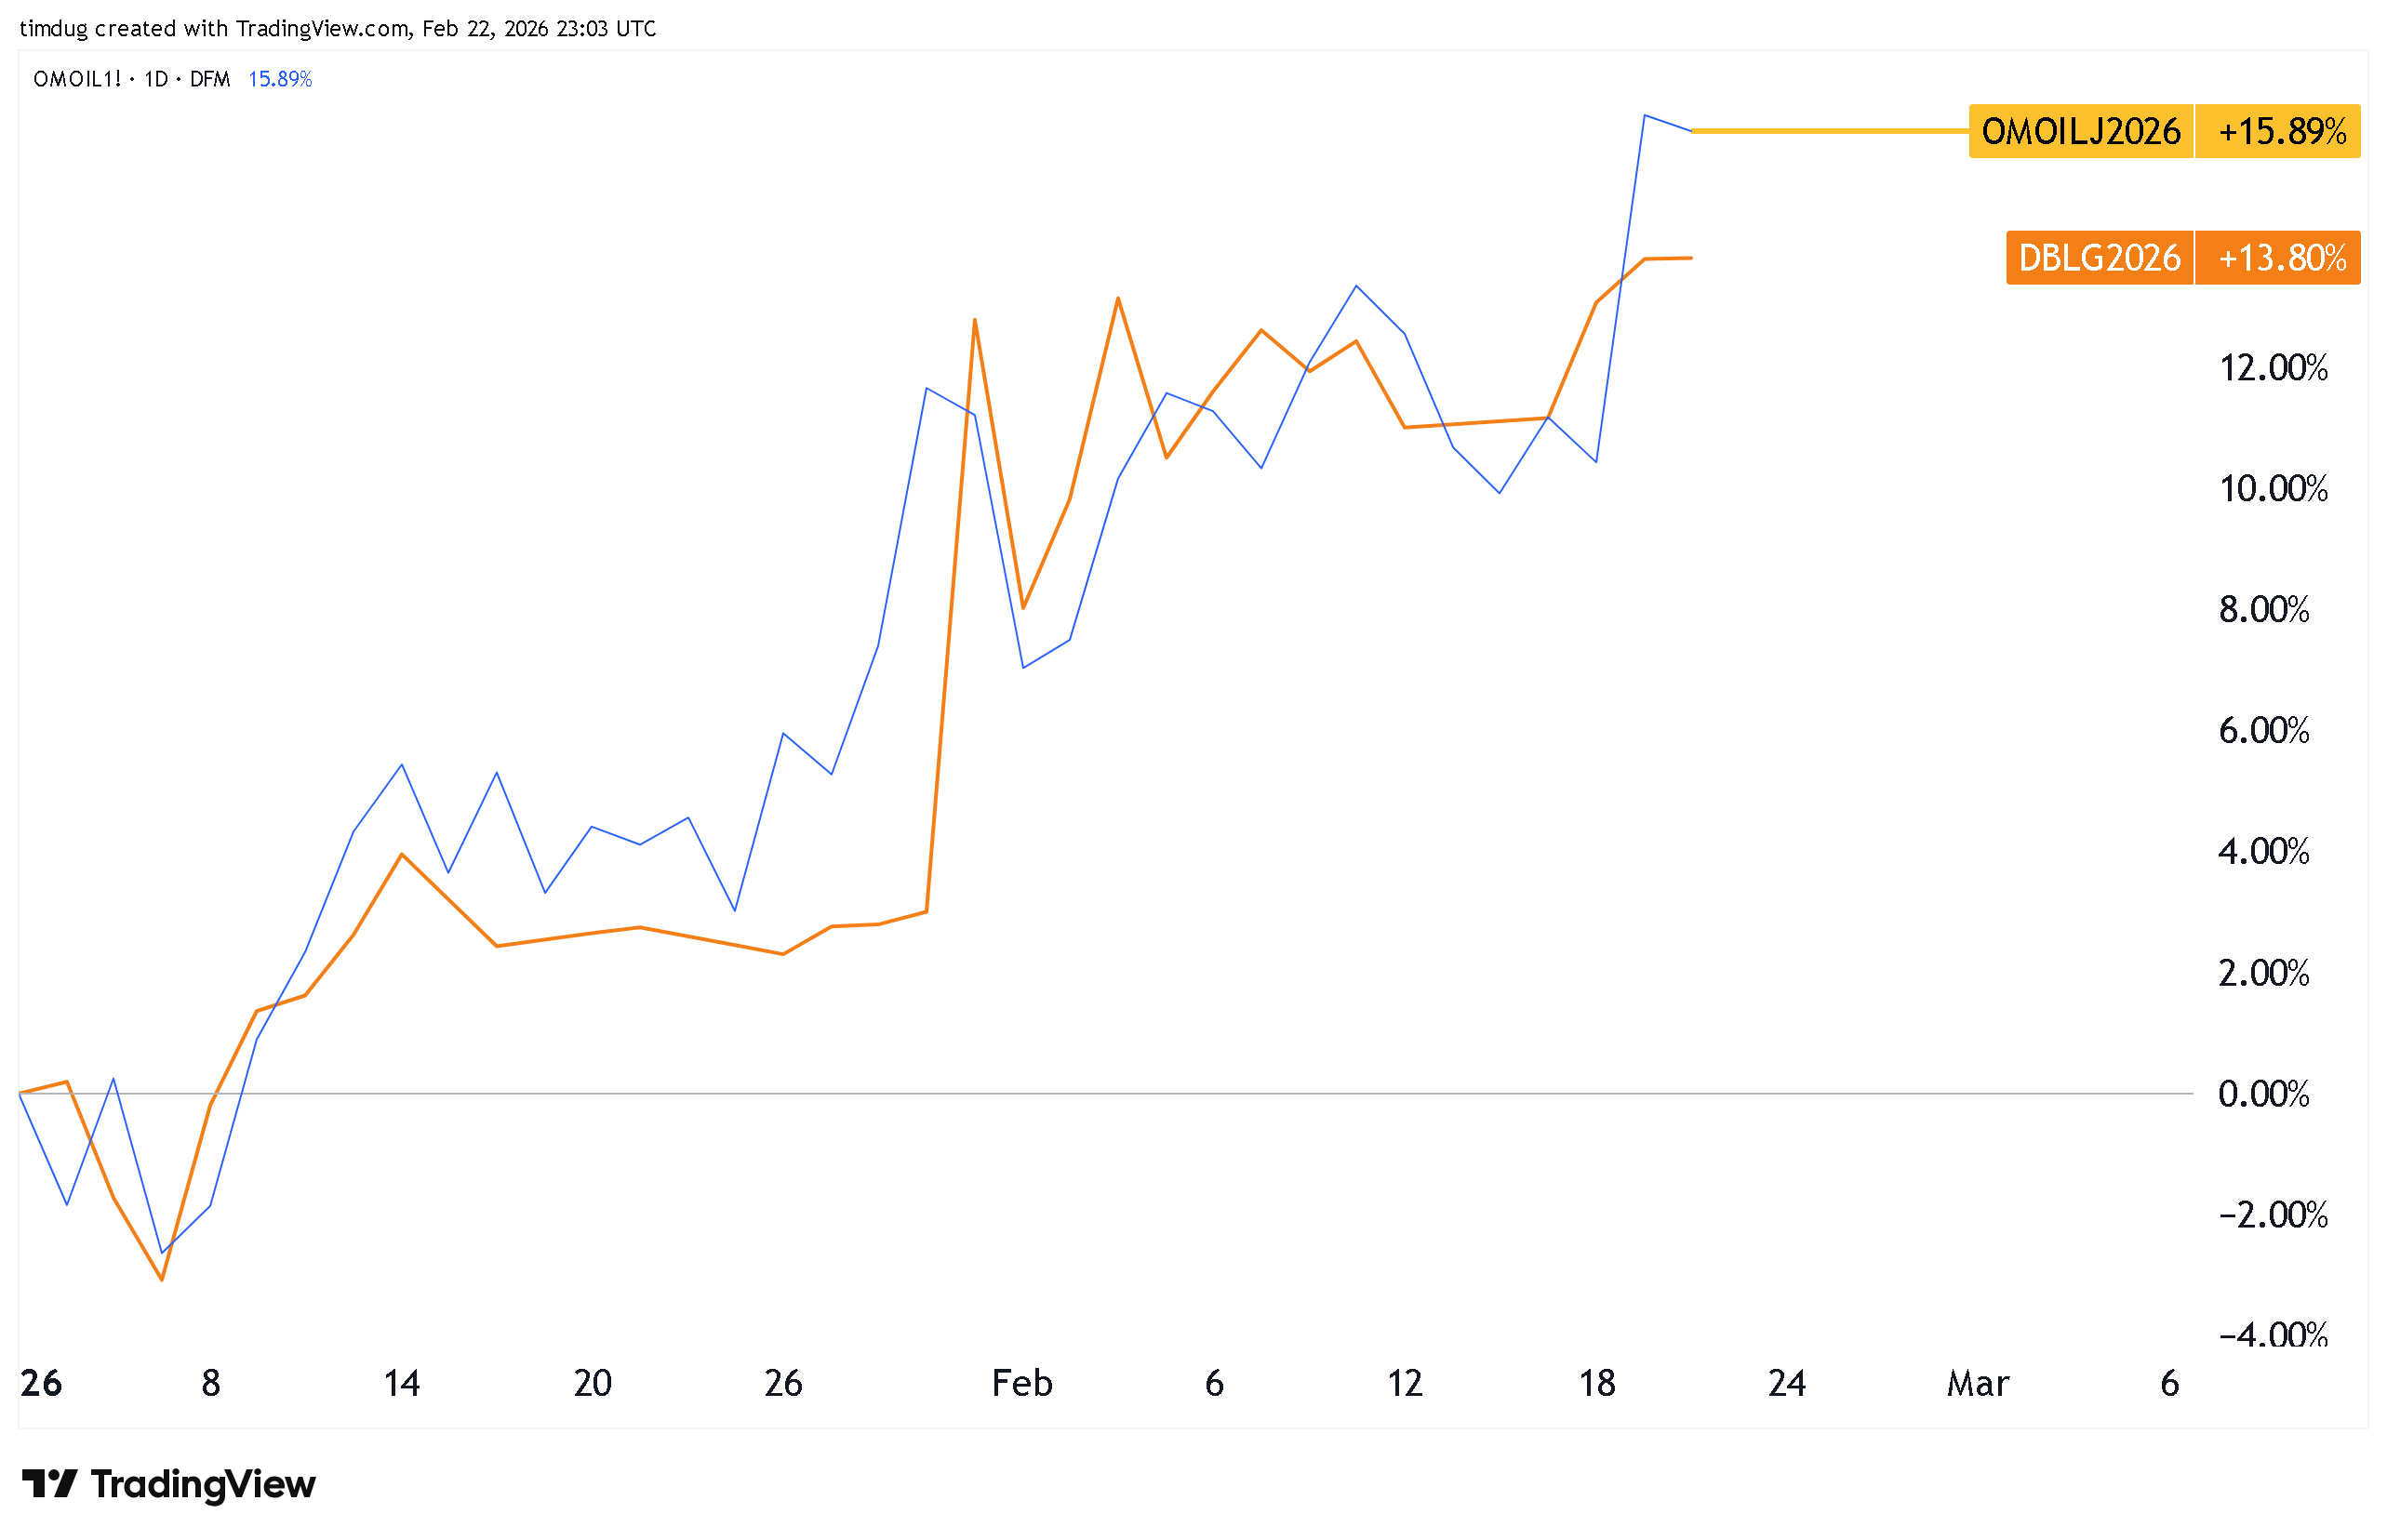
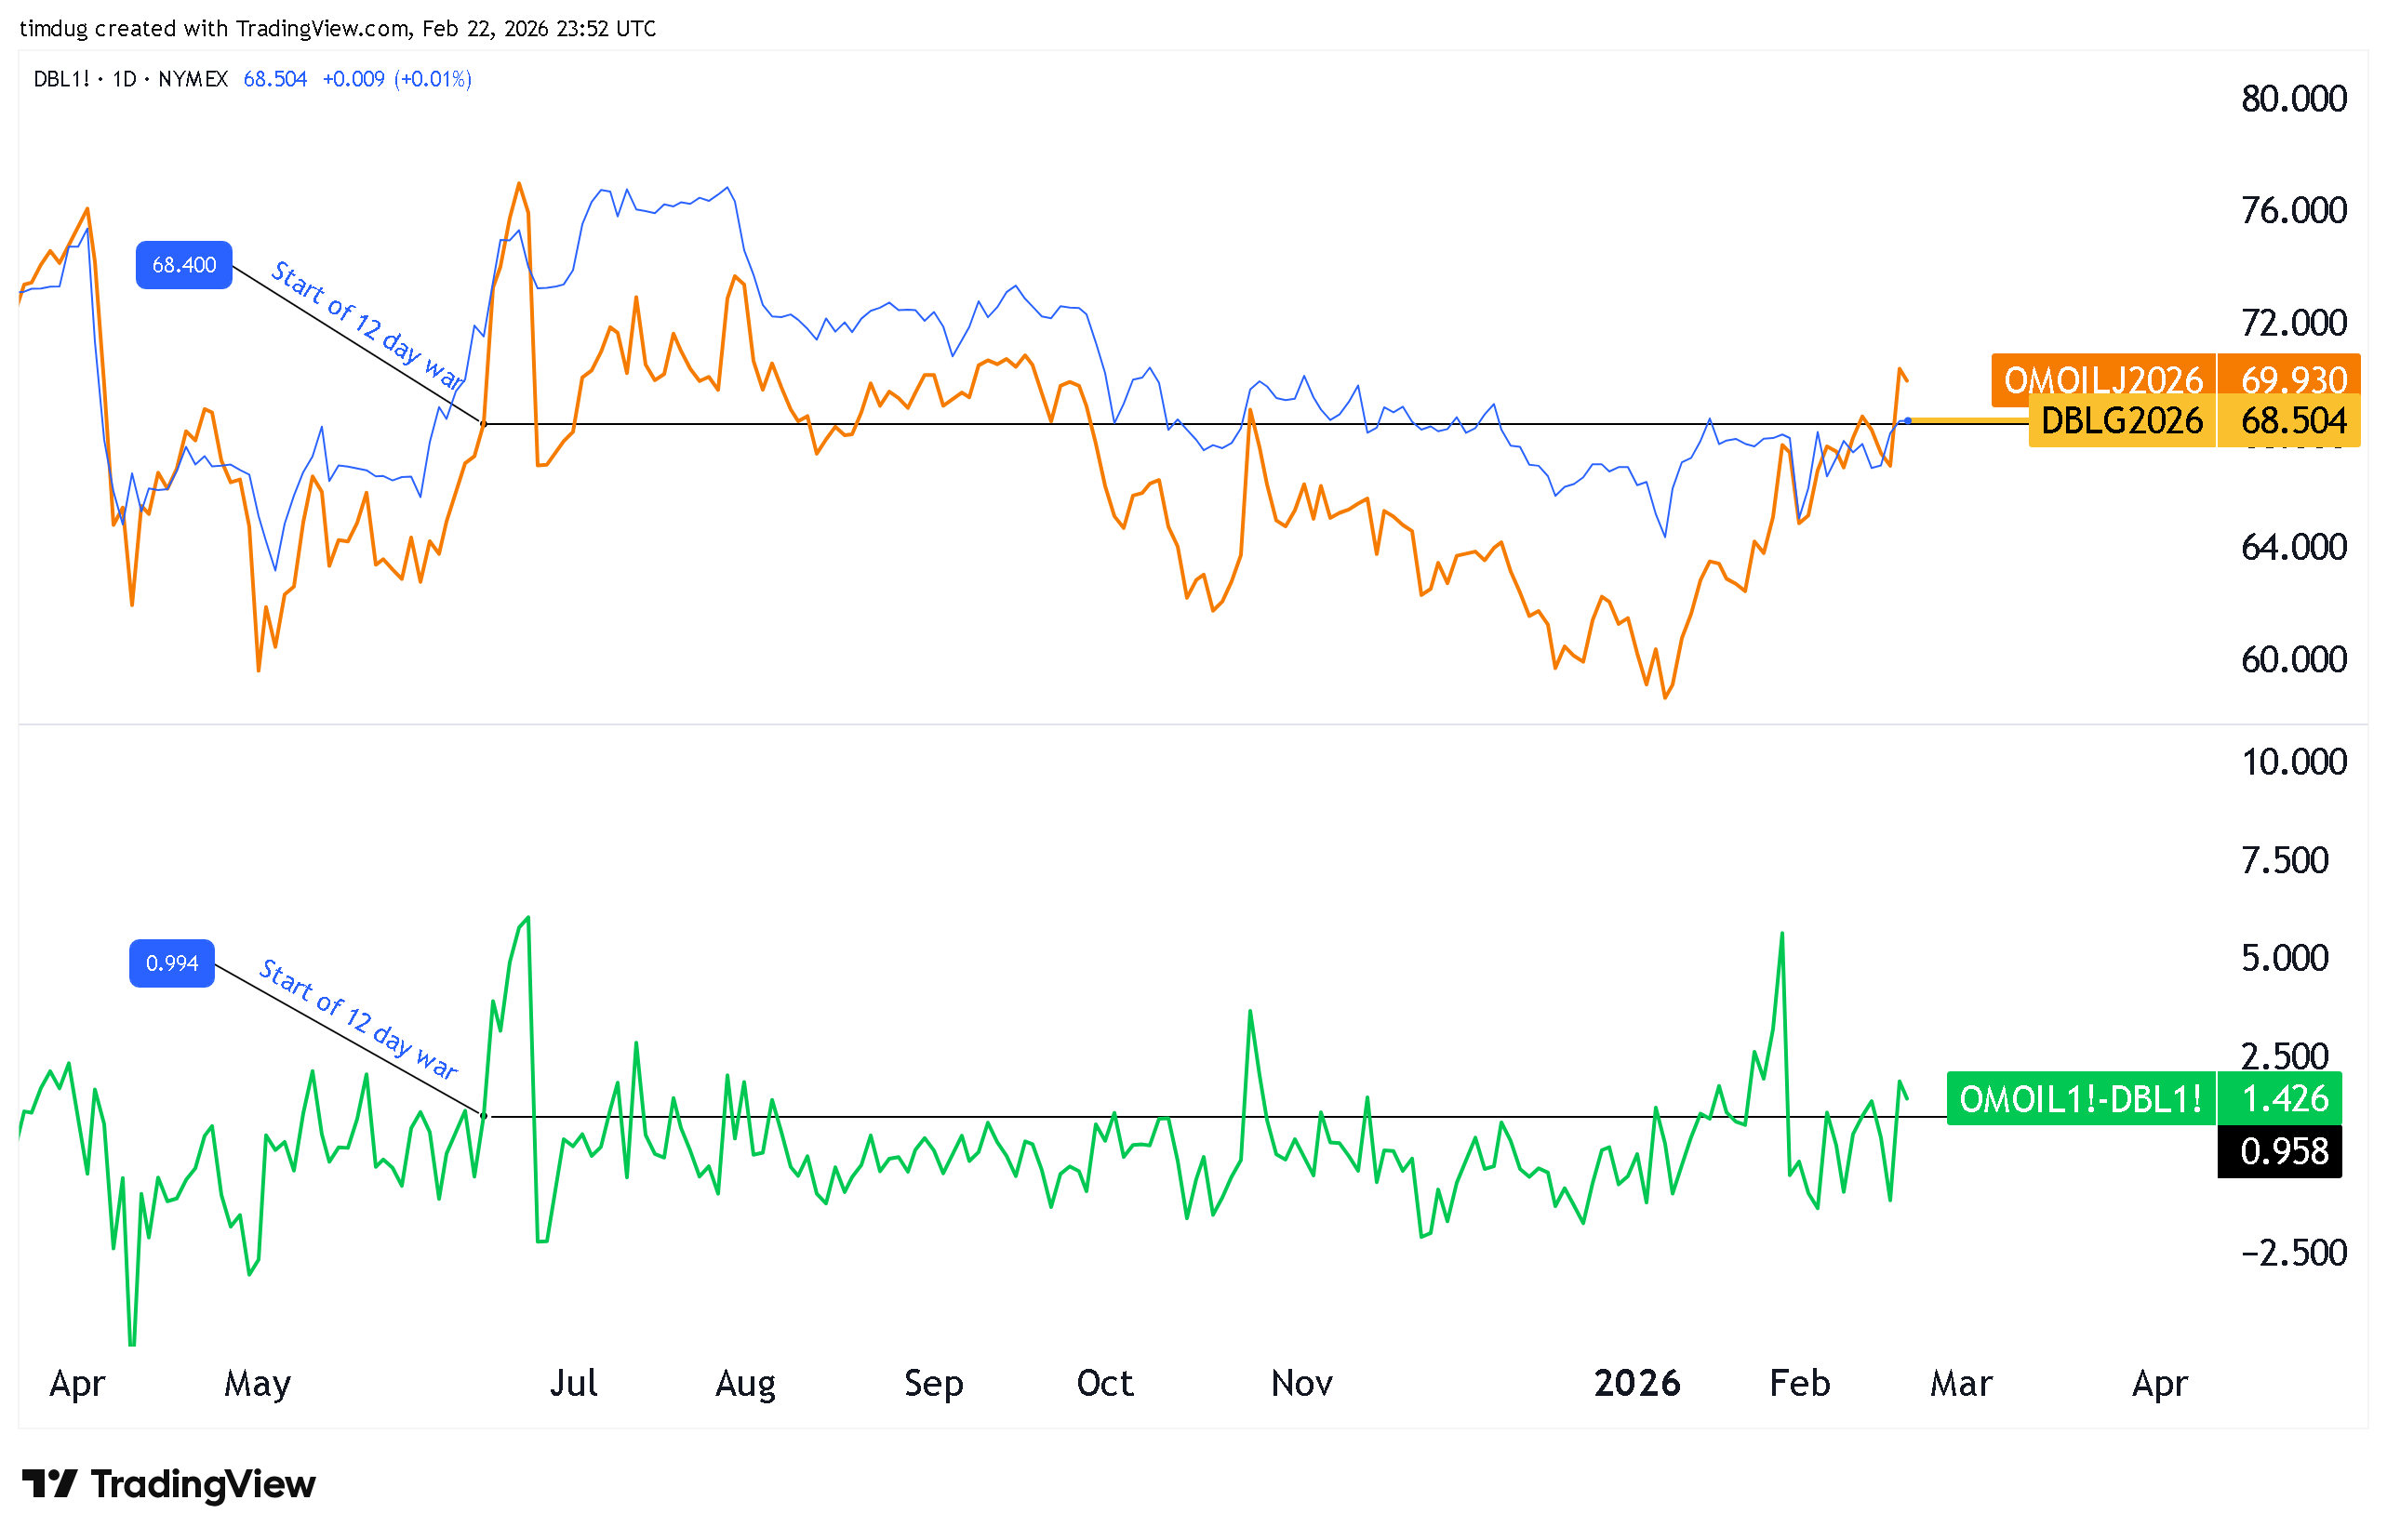
We see that for the YTD, the spread has kicked recently, with Oman trading 3%/ 300 basis points over. However, the spread of the two OMOL-DBL has increased 124% YTD.
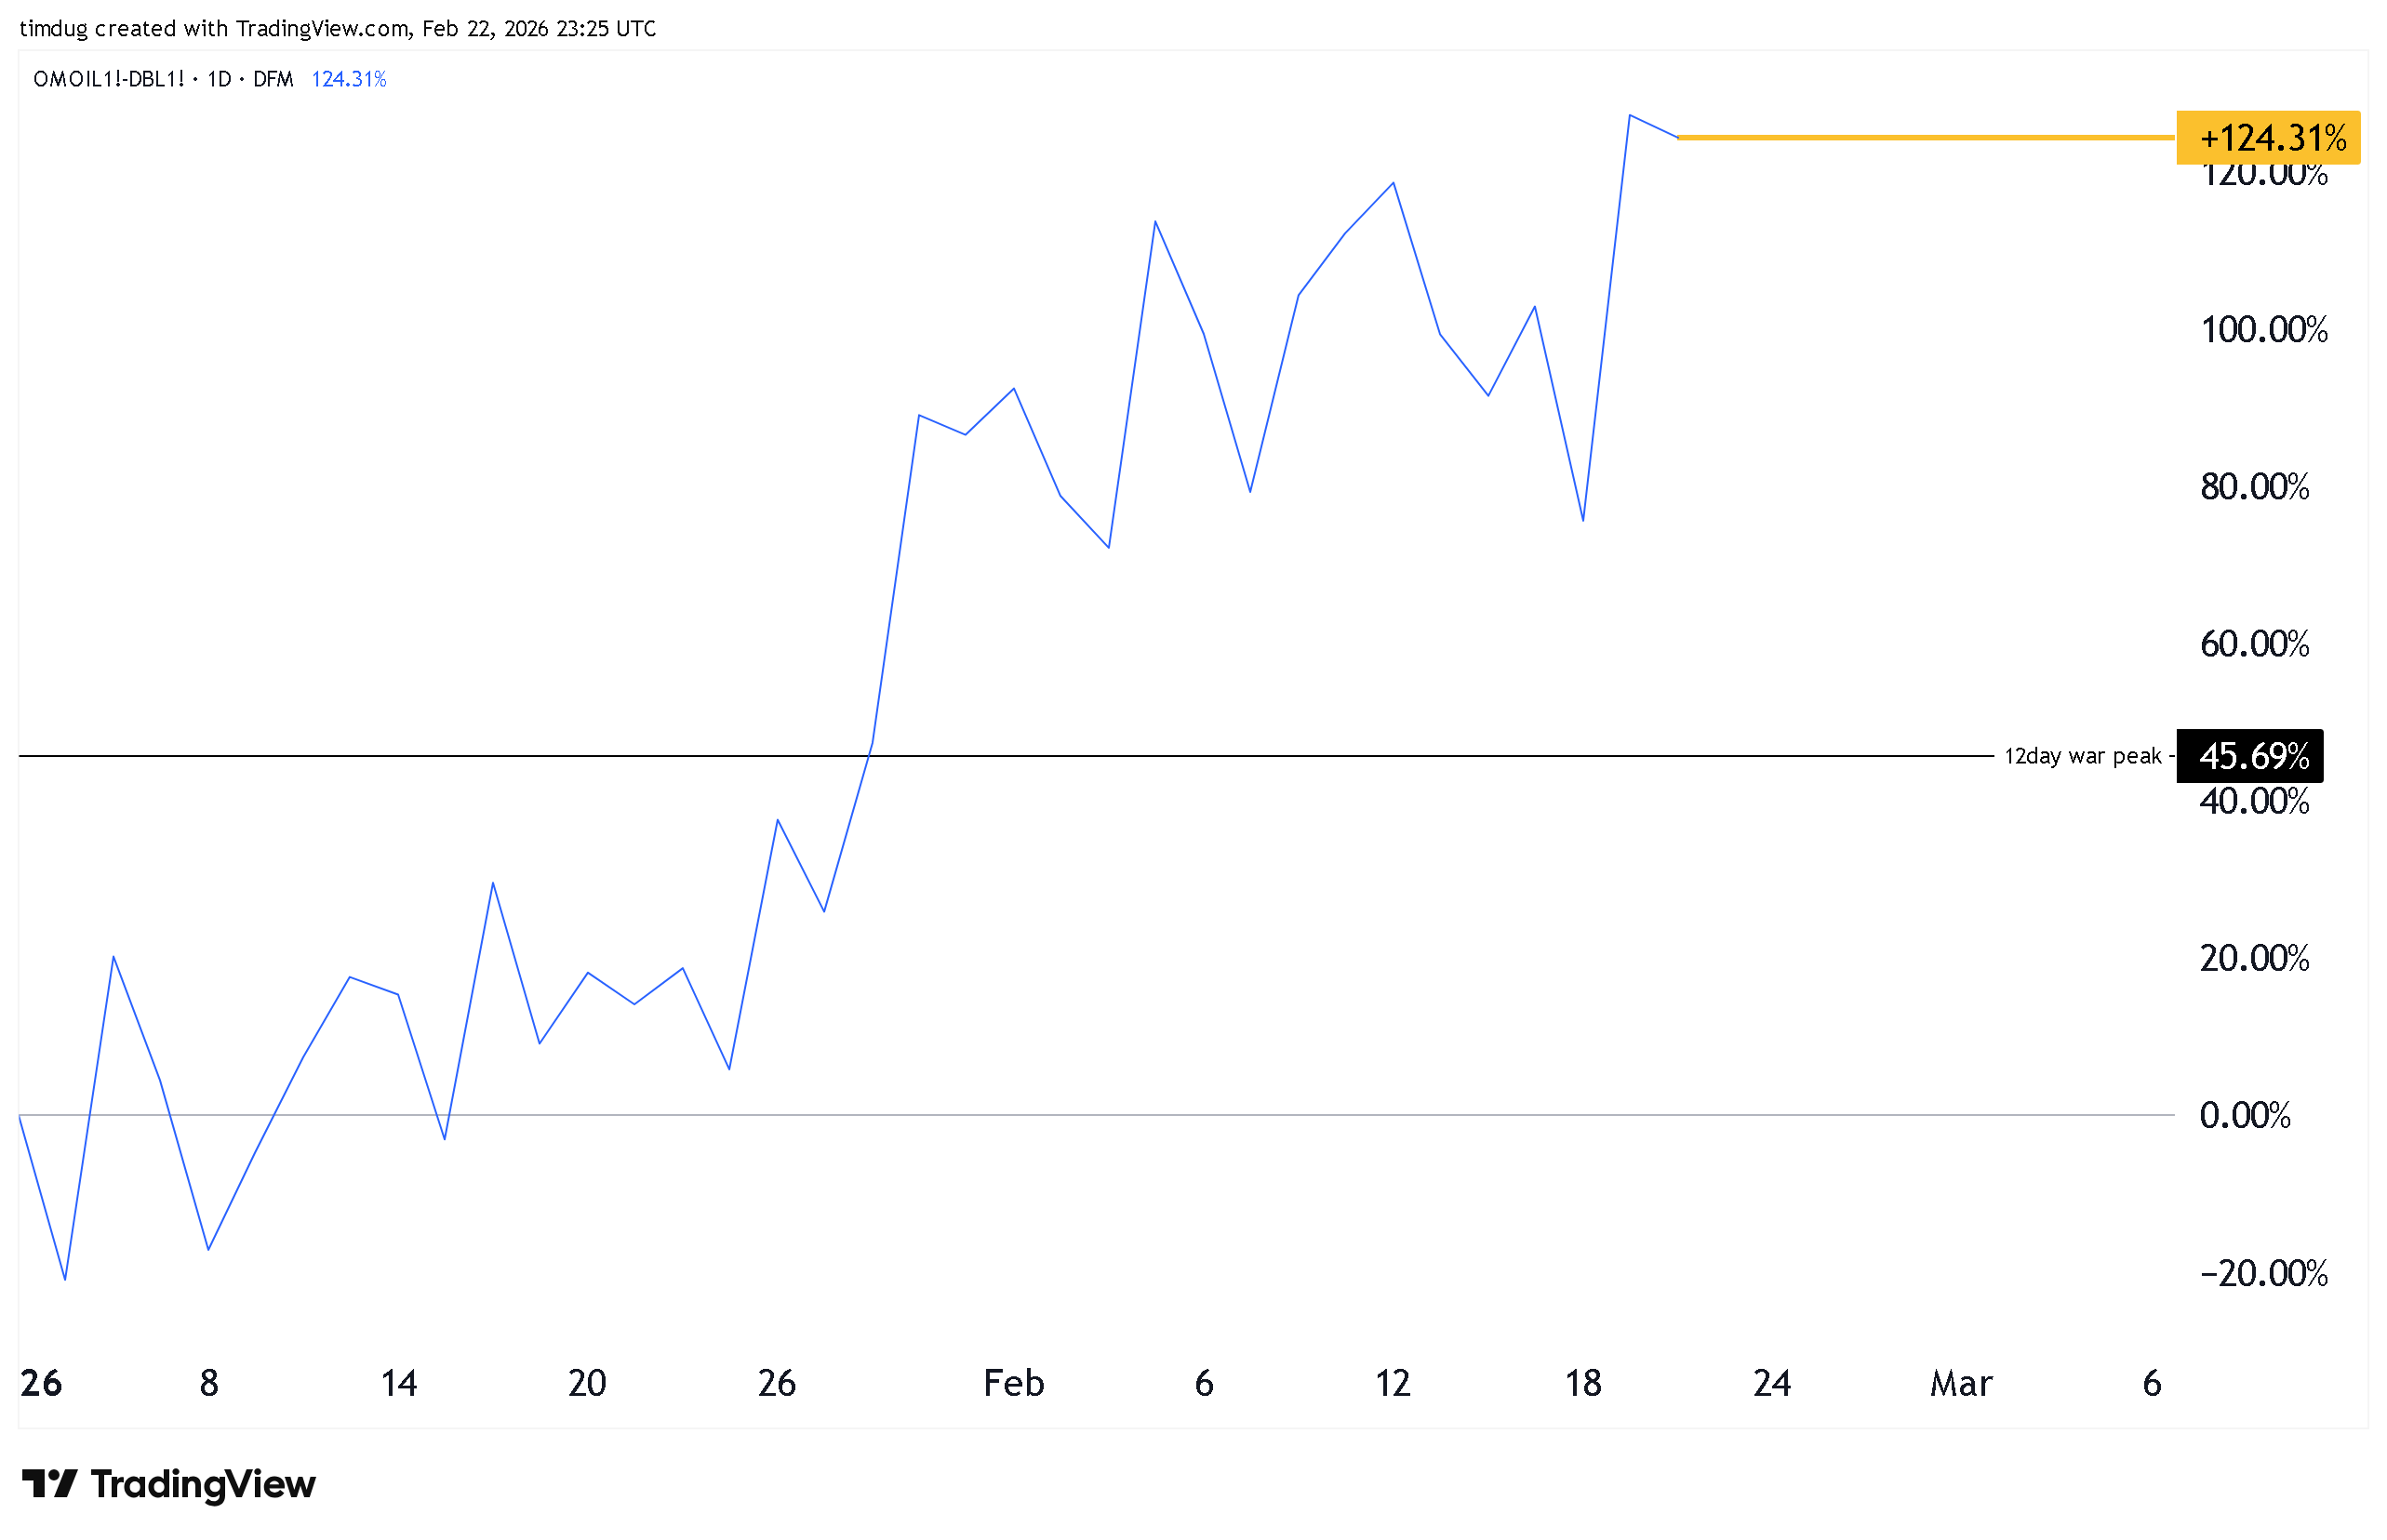
Fortunately, we have a recent risk reference from The 12-day war which priced in on the 12th June 2025. In the chart below, on the top graph you see the two products trade, then below in green, the spread. It is obvious that while not going wild, there is structural pricing starting to occur, ie. Oman going bid over Dubai. What is telling that we have STRUCTURAL pricing risk here, is that we are trading OVER the 12 day war inflection pricing on the spread as of last Thursday, 19th Feb.
This is the early warning sign that the market is firmly priced for disruption risk.
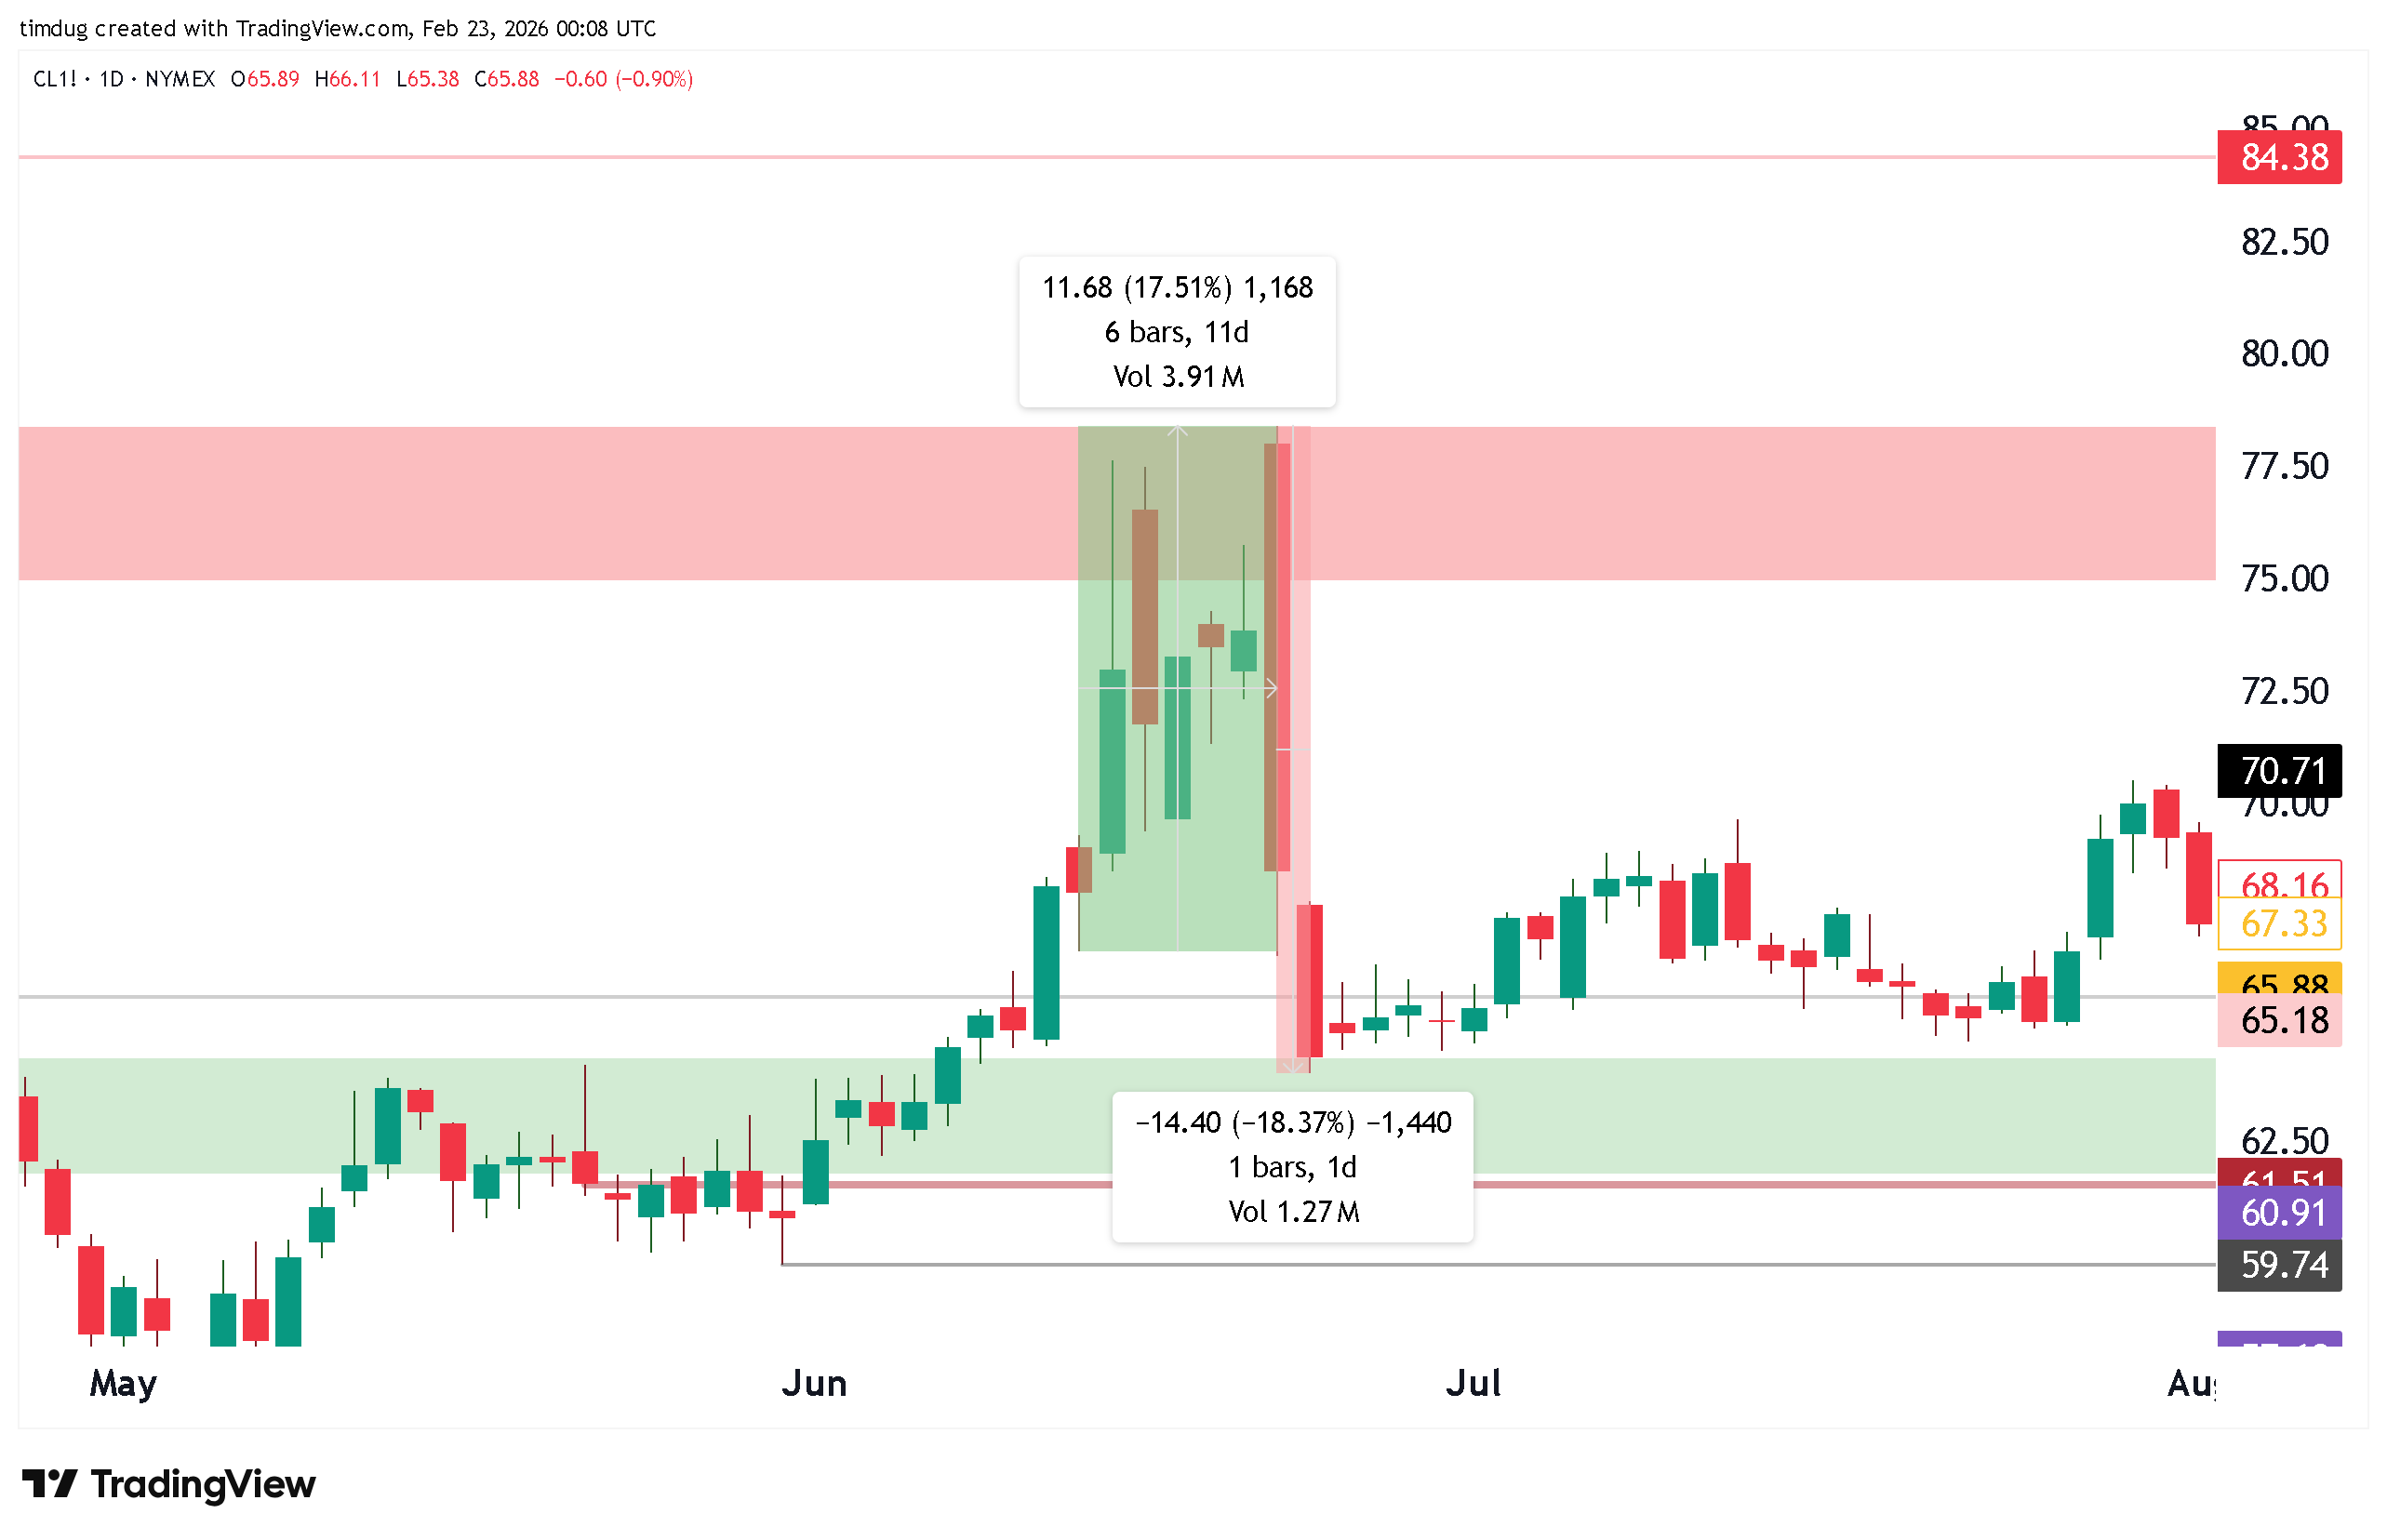
This then segways nicely into talking about mean reversion. Should this situation NOT turn hot Or, more likely, go hot, then dissipate, we would see an aggressive pullback in front month prices. Here is what the 12 day war- (approximately 13th June-approx 25th June) looked like. Up $11.68, then pulled back $14.40. We went up over 6 days. It took us 1 day to mean revert. So if you are riding the bull- know when to get off.

There can be only one
In the latest reports from the EIA, we can see that The US is taking the field in maintaining oil production against its peers of Saudi and Russia.