


In this report: The Hormuz flow numbers that don't reconcile, and the three buffers running out on a schedule.
Last week. Brent +7.82% (+$6.44) Open $83.70 High $90.07 Low $83.33 Close $88.82
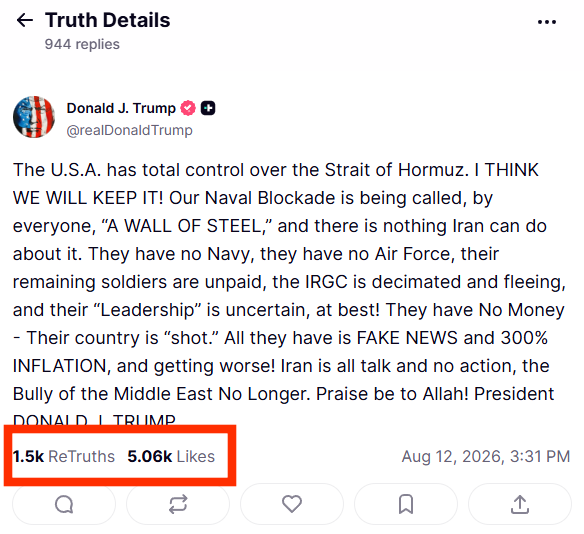
Articles
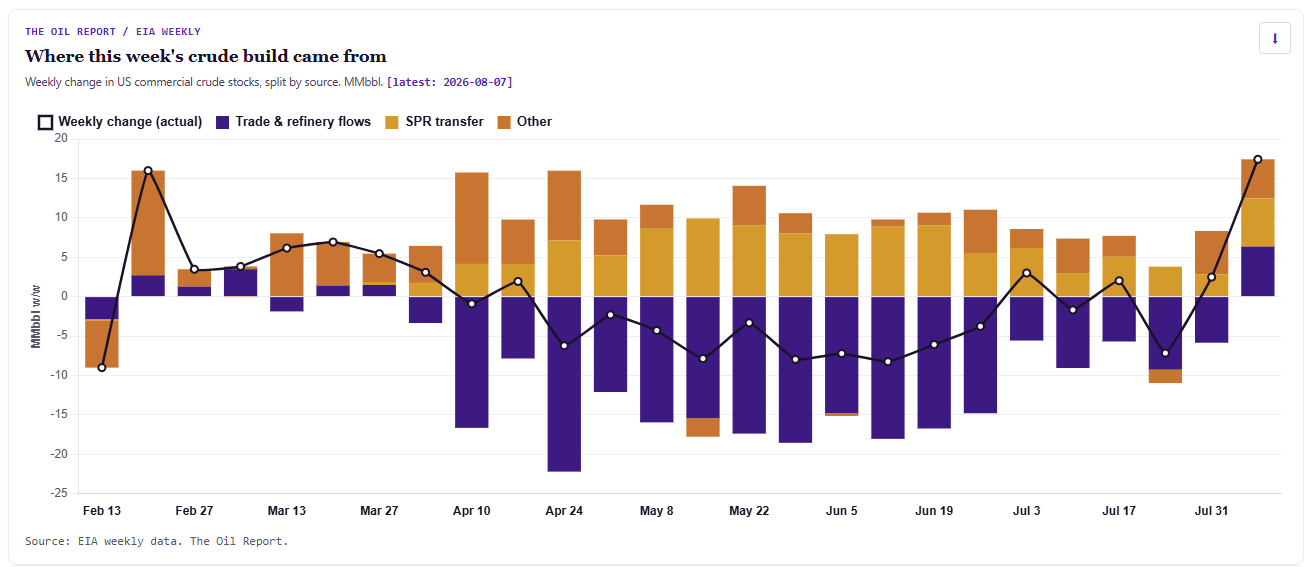
Weekly EIA Inventory Reports large crude build +17mb
US Oil Growth Faces Headwinds as Shale Producers Cut Spending
US says it can keep naval blockade on Iran ‘indefinitely,’ vows more economic pressure
Multiple USS Abraham Lincoln sailors have tried to go overboard amid extended deployment, families say
The Trump administration claims oil is flowing normally again. There’s just one problem
Huge oil slick hitting Oman’s shoreline as agencies warn of disaster
Two grain terminals at Russia’s Novorossiysk halt work after Ukrainian attack, sources say
Diesel desperation is mounting globally
Qatar LNG Loading Jumps Ahead of Potential Hormuz Reopening
View
The one line reality of this oil crisis, in my mind, is this. The tightness in this market gets passed over for Tweets, Truths and soundbites. Reality is a second class citizen.
Regardless, the standing view has been that war tightness is real but is masked by several real factors, and price has remained relatively calm as a result. This week puts names, numbers and dates on the masking. Four things to balance.
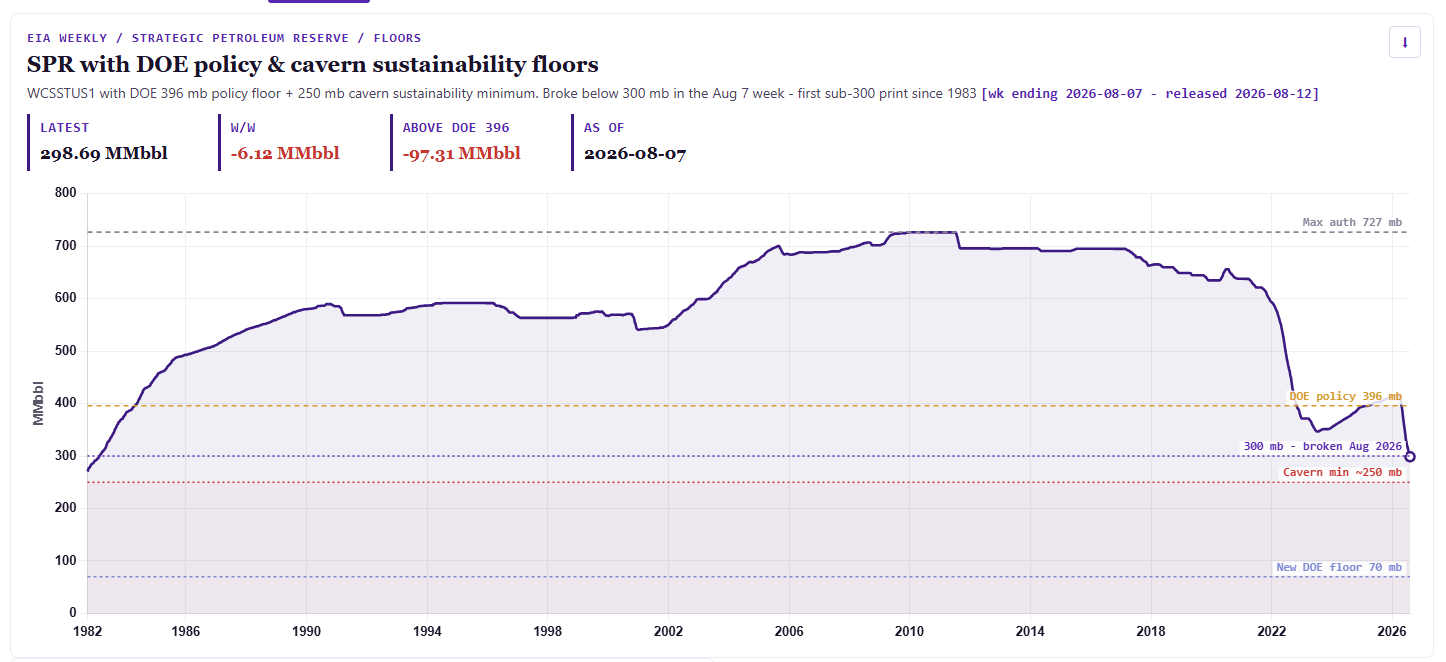
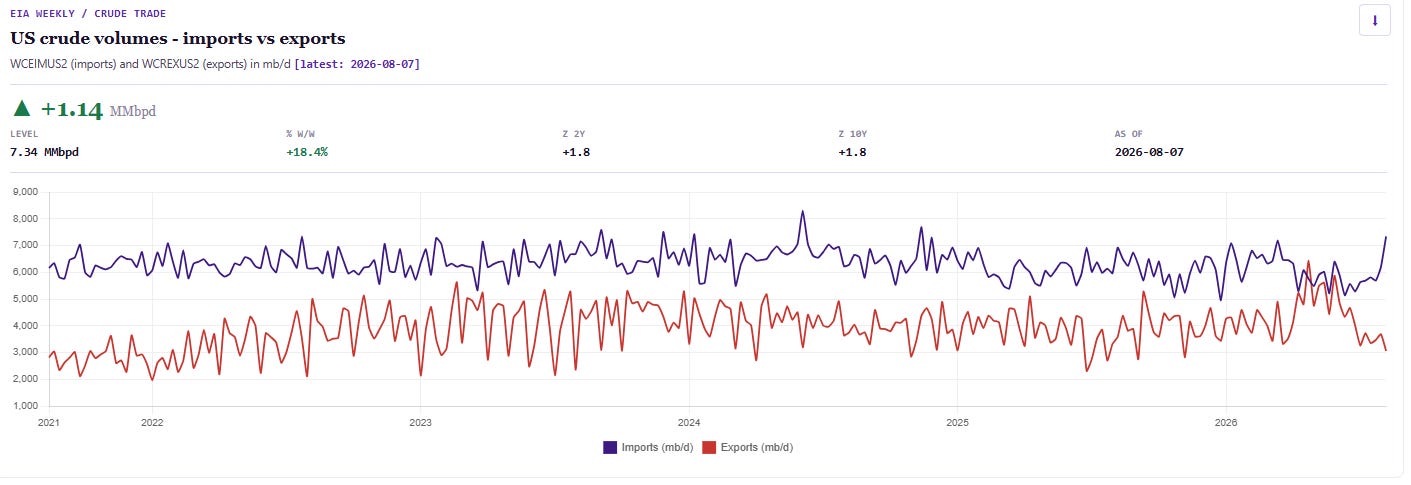
1. The SPR is doing the work, and it is running out of road. Commercial crude built 17.42 mb this week. 6.12 mb of that was the SPR paying out, taking the strategic reserve to 298.7 mb. First sub-300 print since 1983. Net of the government barrel, the build is about 9.7 mb,, imports at 7.3 mb/d and up 1.14 mb/d on the week. In-transit barrels becoming tank barrels is normalisation. It is not new supply.
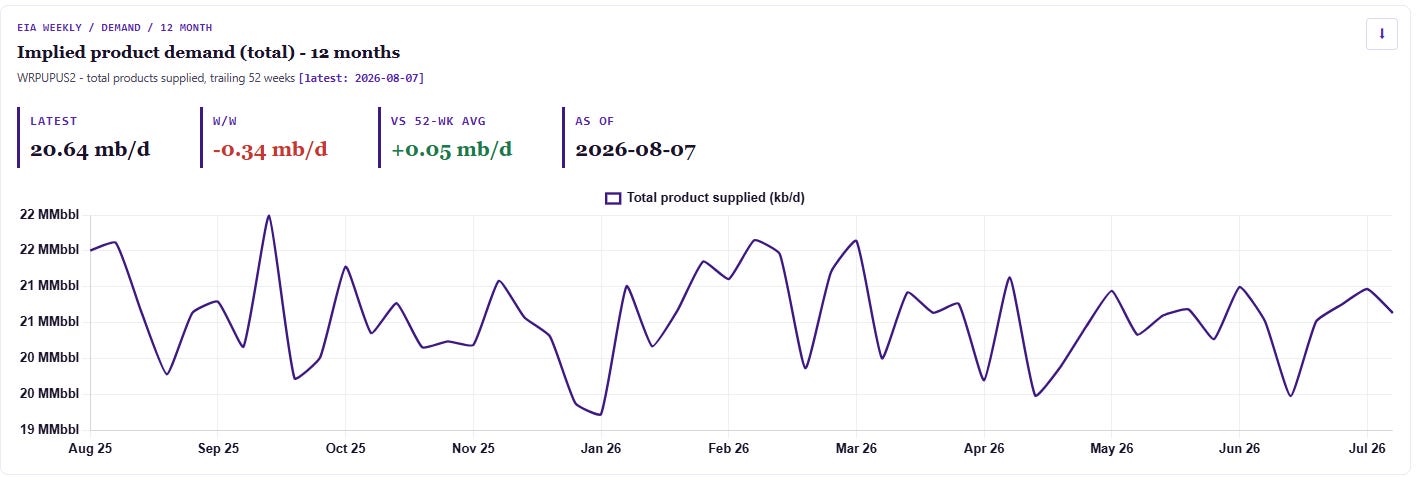
2. Demand is the second buffer, and it now has a date on it. The August IEA cut 2026 by a further 510 kb/d to a 1.6 mb/d decline. The contraction eases from 4.9 mb/d in 2Q26 to 2.8 mb/d in 3Q26, then turns to growth of 580 kb/d in 4Q26. A million and a half barrels a day of consumption has been priced out of existence, and the IEA has that demand coming back in November.
3. The bypass cannot take the load. Petroline moves 7 mb/d across Saudi to Yanbu. Yanbu loads 4.5 mb/d nominal at current record highs, Vortexa put it nearer 3 under wartime conditions, and Aramco takes about 2 mb/d into its own Red Sea refineries before an export cargo sees a berth. The issues is now that the Jazan Red Sea refinery was hit by The Houthis-more below. ADCOP adds 1.5 mb/d to Fujairah with roughly 440 kb/d of genuine spare. The IEA puts the entire bypass ceiling at 3.5 to 5.5 mb/d. A lot less than the headline figures. This is a berth problem, not a pipeline problem, and berths will take years to expand.
4. And the fourth is the US Energy Secretary, who has a maths problem.
The counting problem
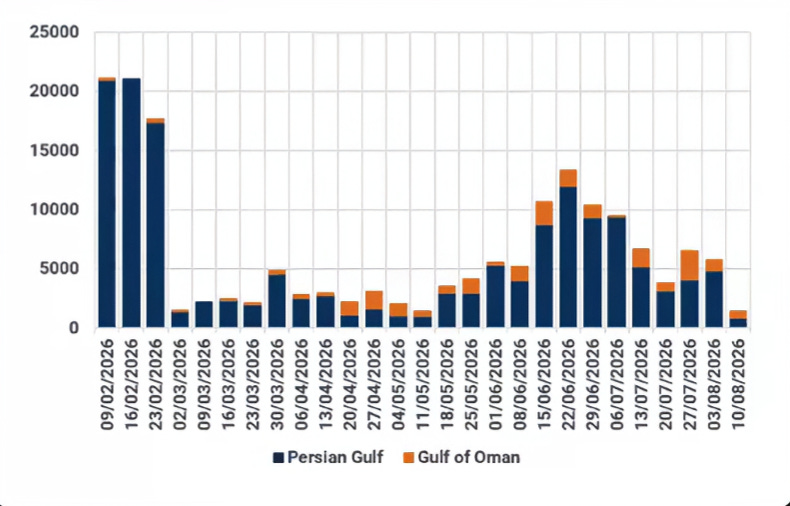
Energy Secretary Chris Wright told us this month that on Sunday alone, over 20 million barrels left the Arabian Gulf region (bullshit). He put the seven-day average through Hormuz at almost 9 mb/d, with another 5-7 mb/d moving by bypass pipeline. Big numbers. Let’s put them beside everybody else’s. Grade A bullshit!
Chris Wright, US Department of Energy: almost 9 mb/d by sea, 5-7 mb/d by pipe
Commodity Context: 7 mb/d by sea, 4 mb/d by pipe
Kpler: 5 mb/d by sea
EIA Short-Term Energy Outlook, August: 4.9 mb/d through the Strait, 2Q26 average, against 21.6 mb/d in 4Q25
That last one is the EIA. The EIA reports to Wright.
Two caveats before anyone writes in. The STEO figure is a second-quarter average and Wright’s is an August seven-day print, so they are not measuring the same window. And Goldman flag that Persian Gulf export data gets revised upward over time, with dark flows nobody is capturing cleanly. Both of those cut in Wright’s favour.
Neither closes a gap this size. Transits ran 8 to 15 vessels a day in early August against roughly 130 before the war, and traffic hit a three-month low on the 12th. Flows did not double into three-month traffic low.
The bypass claim is the one I would look at hardest. The IEA puts the entire bypass ceiling - Petroline plus ADCOP, everything - at 3.5 to 5.5 mb/d. Wright’s range starts at 5 and tops out at 7. The upper end of his estimate sits above the top of the whole system’s capacity. Brett Erickson at Obsidian Risk Advisors put it plainly: ‘‘there is not a modicum of evidence for the higher numbers.’’
The market traded it anyway. Brent sold off on the 13th on a transit figure nobody outside the administration can reproduce.
The official flow numbers do not reconcile with the tracked ones, and the widest gap is in the bypass, where the physical ceiling is already known.
I am not going to tell you which figure is right. I will tell you which one I am using. Kpler and Vortexa get my barrels. They count boats with satellites.
Bad al Mandeb
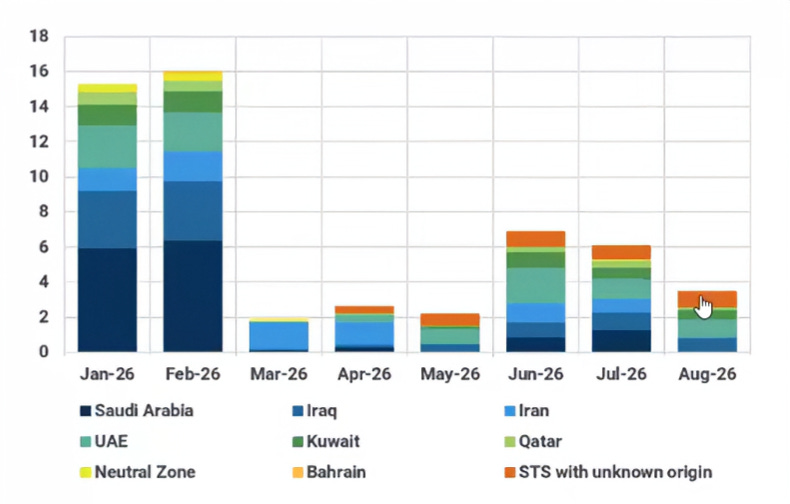
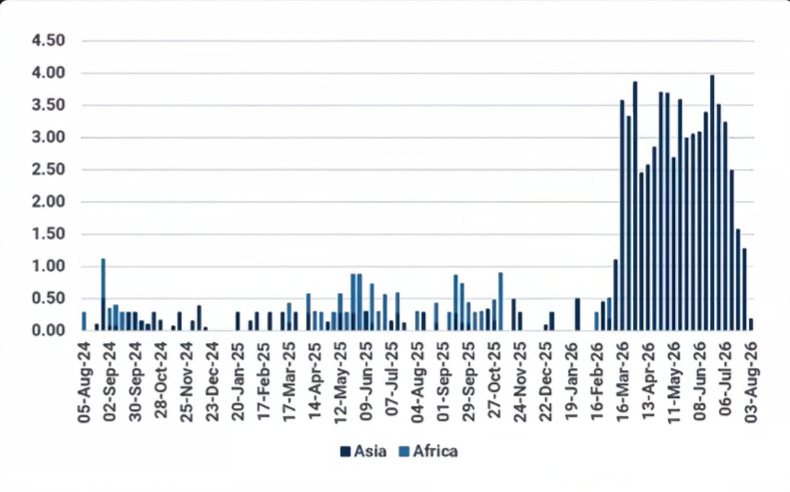
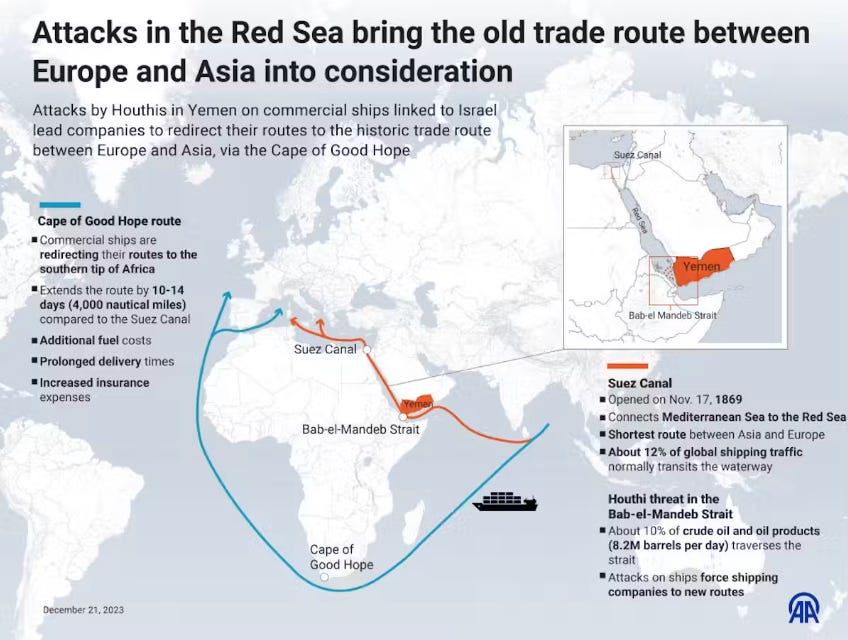
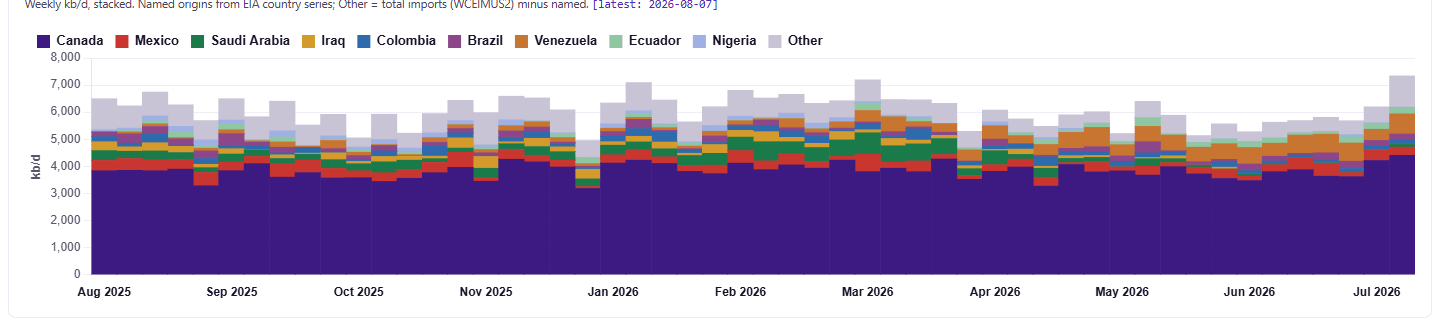
Yanbu exports via Bab al Mandeb averaged 3.5mbpd in July have now moved down to a few thousand. Add to this the shutdown of the Jazan refinery, Saudi inventories thus climbed to 75mb in August so far, from 61mb in June. This has served to push all of Saudi exports to move through Suez. An Indian buyer of Saudi crude has to get delivery via Spain and then The Cape of Good Hope. A 40-day leg.
US Inventories bump up
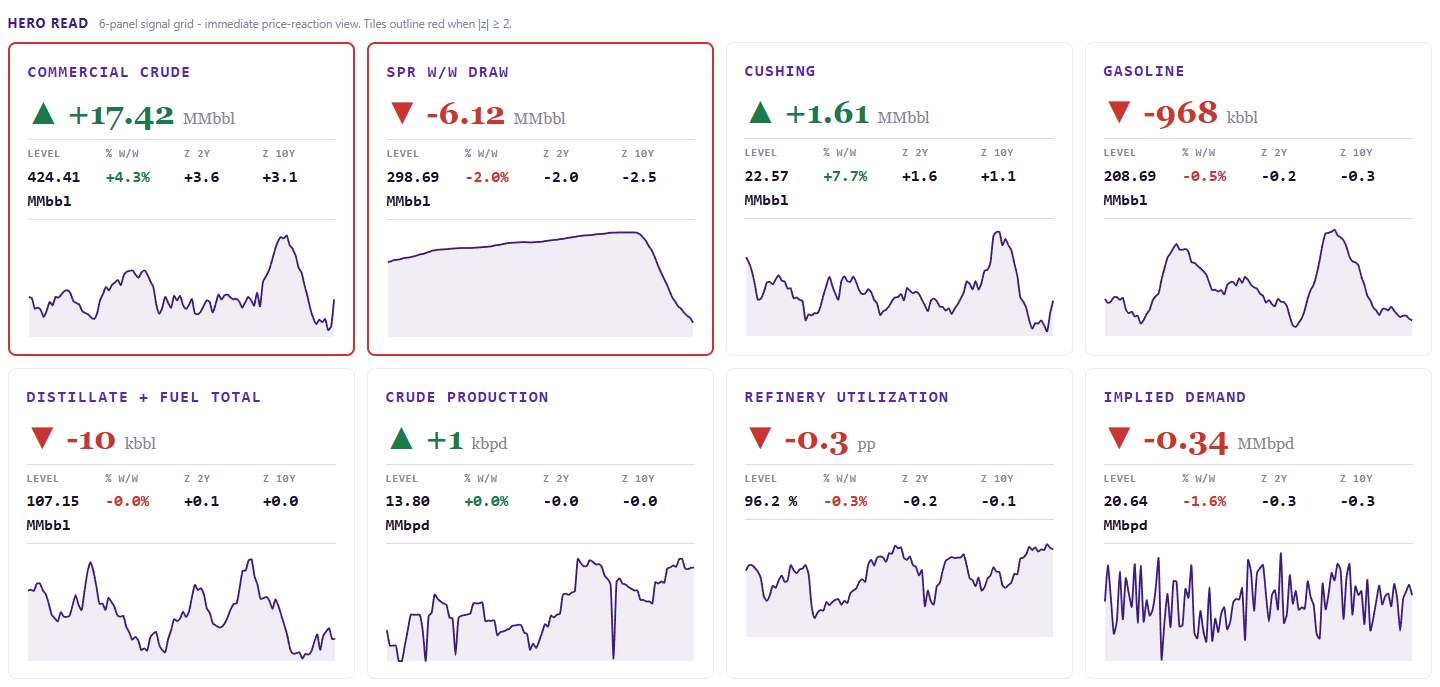
The bulge of the +17mb build really came from a large adjustment up. The adjustment is the EIA's balancing item - the gap between what the tanks say happened and what the measured flows (production, imports, exports, refinery runs) can explain. Tank gauges are a hard count while the flow data is sampled and estimated. A persistently large positive adjustment means barrels are showing up in storage that the surveys never saw arrive - right now, almost certainly imports undercounted as MEG tanker armada lands faster than the weekly sampling catches. The graph below serves a good way for me to rapidly see where the bulk of the WoW changes actually come from. A small element of the internal energy dashboard that I run.
Black sea - We need to talk grains!
Its time to look at the Ags complex. Below and in the trade section, I look at where I think these markets are going- Corn, Wheat, Cocoa. TTF (Euro Gas) also covered as it came up in conversations over the last 2 weeks.