


This week, access to the C.O.T analysis and trading charts is free and open to show readers a sample of the in-depth tools that I use. The C.O.T will only be available to ‘Trader’ monthly paid subscribers level subscriptions going forward. I want to remind you that all paid subscriptions are tax-deductible in all territories as ‘market research’.
In this report: The boom is tailing off, rigs continue to drop with higher efficiency rates and Saudi makes money while India scrambles to replace Russian imports. C.O.T analysis showing extremes. Trade charts as below.
Views
In simple-we snap back up. The market is at extreme selling levels and is due a snap back. Read below in the commitment of traders section for the data and charts on this.
Articles
The US Oil Shale Industry Is Doing More With Less
Blackout hits central, southern Iraq, sources say
China Urges Firms to Avoid Nvidia H20 Chips After Trump Ends Ban
Russia Spreads Out OPEC+ Penance, Easing Path to Hike Supply
Macro
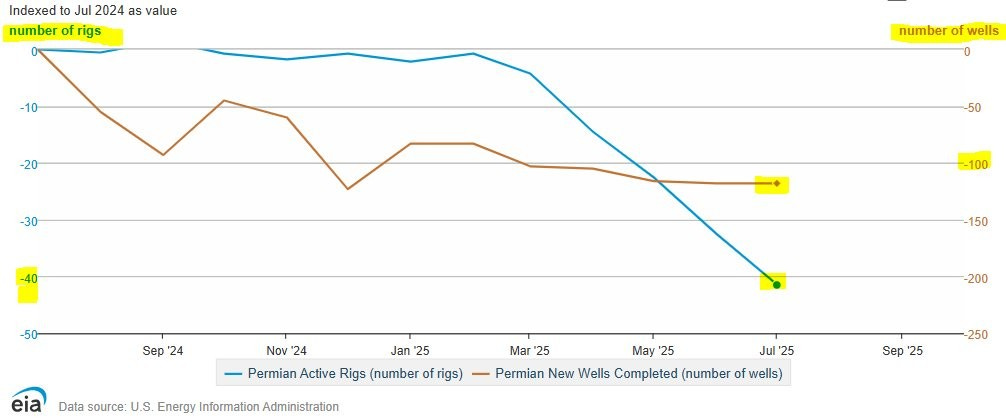
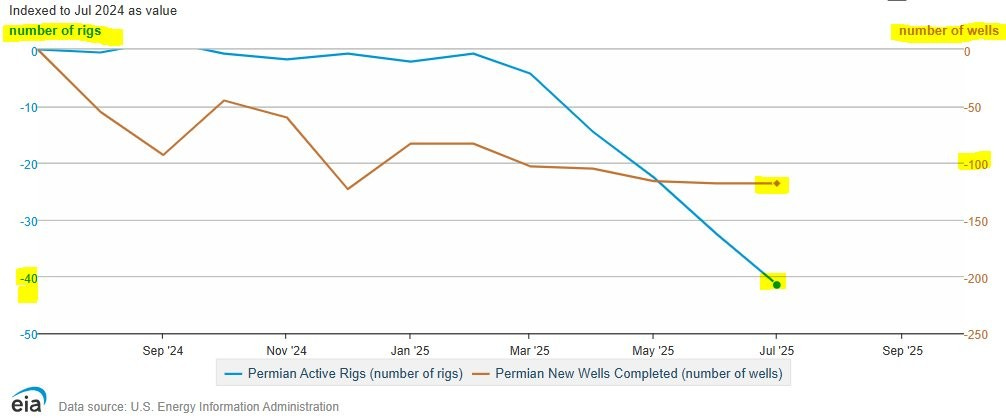
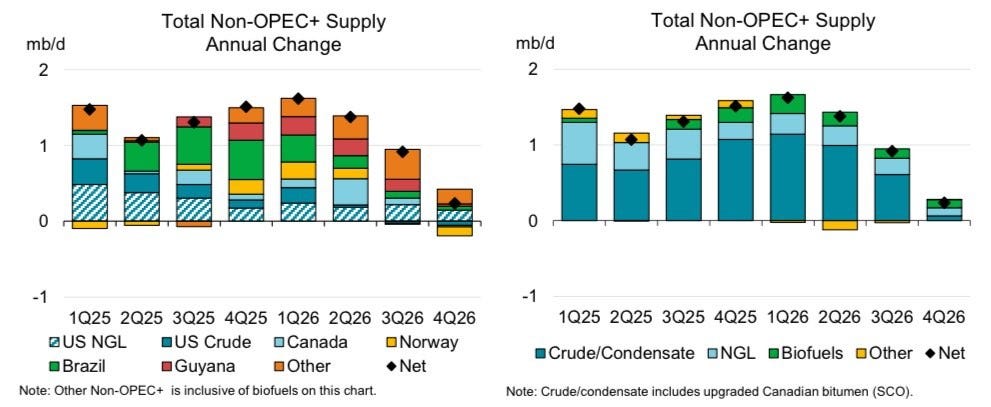
There are some clear dynamics coming into play currently. U.S. production is still at growth levels, despite diminishing rig count levels through the last 12 month. This is led by the impact of more efficient production on wells and the implementation of certain A.I. technologies in production and work over wells. Doing more with less is the future of E&P.
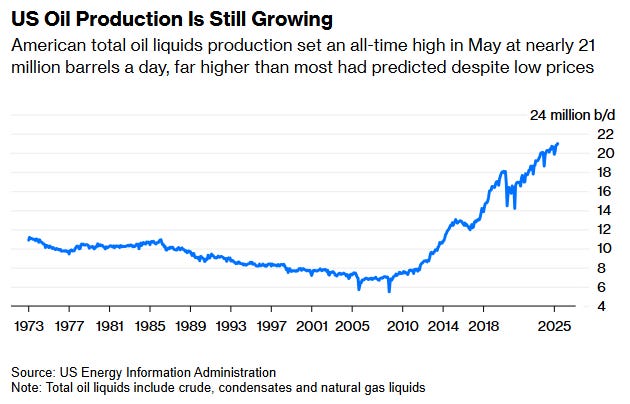
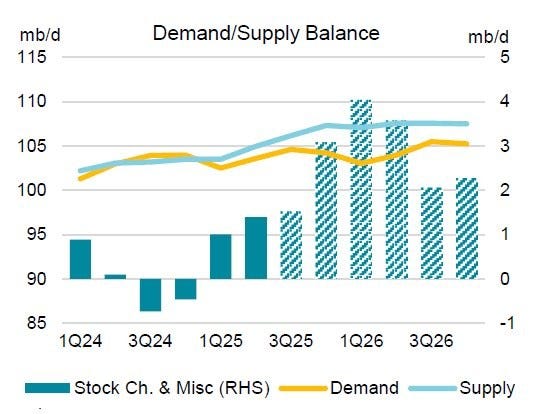
However, the oil boom may be calming. Not due to geological constraints, but due to limiting economics of current oil prices. Oil is trading at or below most shale producers break even levels. This curbs investment in future E&P. Adding to the headwinds for continued growth is the latest Demand/Supply picture from IEA.
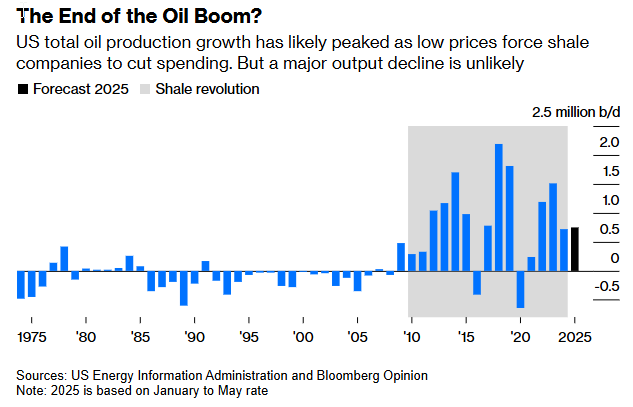
Time for producers/drillers to tighten up on cap ex and go to those M&A meetings they have been putting off.
Supply
We can see a diminishing supply curve globally out through 2026. Blame it on E.Vs, blame it on what you want, but this is where it is at. This will be a tough time for the global industry as it will have to reconfigure. The workforce will contract in exploration and production, and the financial departments will stagnate. We are entering a new age of oil. Not the end of oil.
Demand
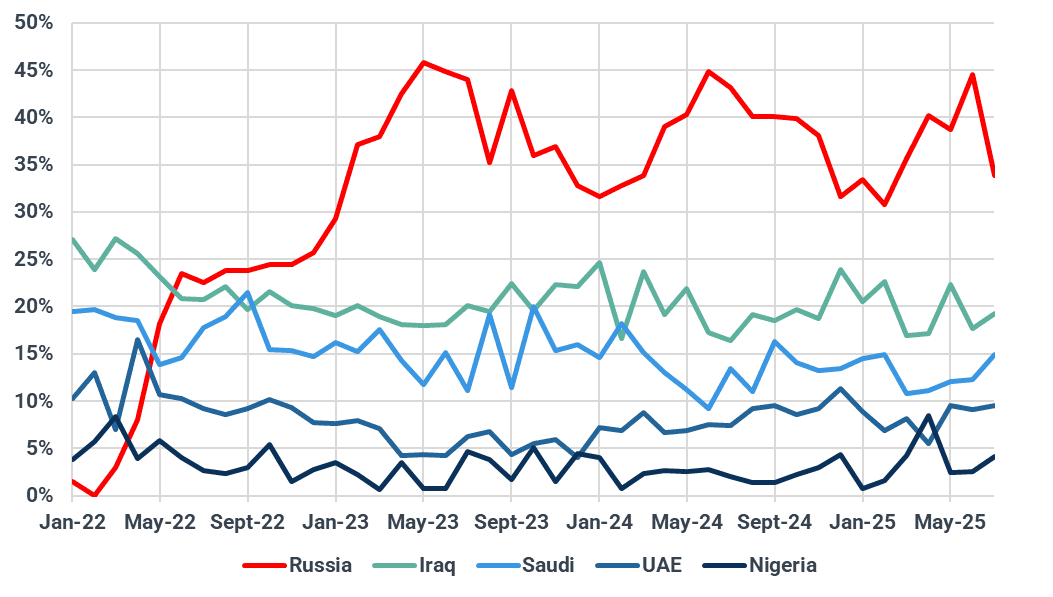
We have seen demand stable from one sub sector of crude consumption- petrochemical feedstocks. The big consumers for this are China and India. So this has placed a massive focus on those demand curves. Now, Trump has put sanctions via Tariffs on India if it continues to buy Russian crude. That is an extremely well targeted tariff, one which has sent Indian refiners scrambling for alternative sources. No wonder Saudi raised the price of Dubai crude.
Saudi Aramco raised the September OSP for its flagship Arab Light crude to $3.20 per barrel above the Oman/Dubai average. This represents a $1 increase over the August premium.
Other grades, namely Arab Extra Light, Arab Medium, and Arab Heavy, were also lifted—each gaining approximately $0.70 per barrel from August levels
OPEC+ Price war
The price war may seem like it is coming to an end, with OPEC+ having returned approx 2.2mil barrels of supply cut since the pandemic. However, if this was only a return to previous production levels and not a war of aggression, OPEC will leave it at that for the hikes. Traders should be mindful there may be another production hike should the main grades of Brent and WTI bounce +$5-$7 off of current max positioning short.
OPEC forecast a tighter global oil market than previously projected, citing accelerating demand growth and a slower expansion in rival supplies. The cartel raised estimates for world demand growth in 2026 by 100,000 barrels a day to 1.4 million a day. It trimmed forecasts for supply growth outside the group by the same amount. The data suggest global oil inventories will deplete next year — by almost 1.2 million barrels a day — unless the group and its allies revive more of the production they halted.
“More production, less spending.” Jeff Leitzell, chief operating officer of shale giant EOG Resources Inc.
Commitment of traders - WTI
Commercials
I use a proprietary Duggan Capital in-house tool to study C.O.T data. I’m happy to bring this to The Oil Report, however going forward this will only be available to paid monthly subscribers.
Market Regime
What is Regime Detection?
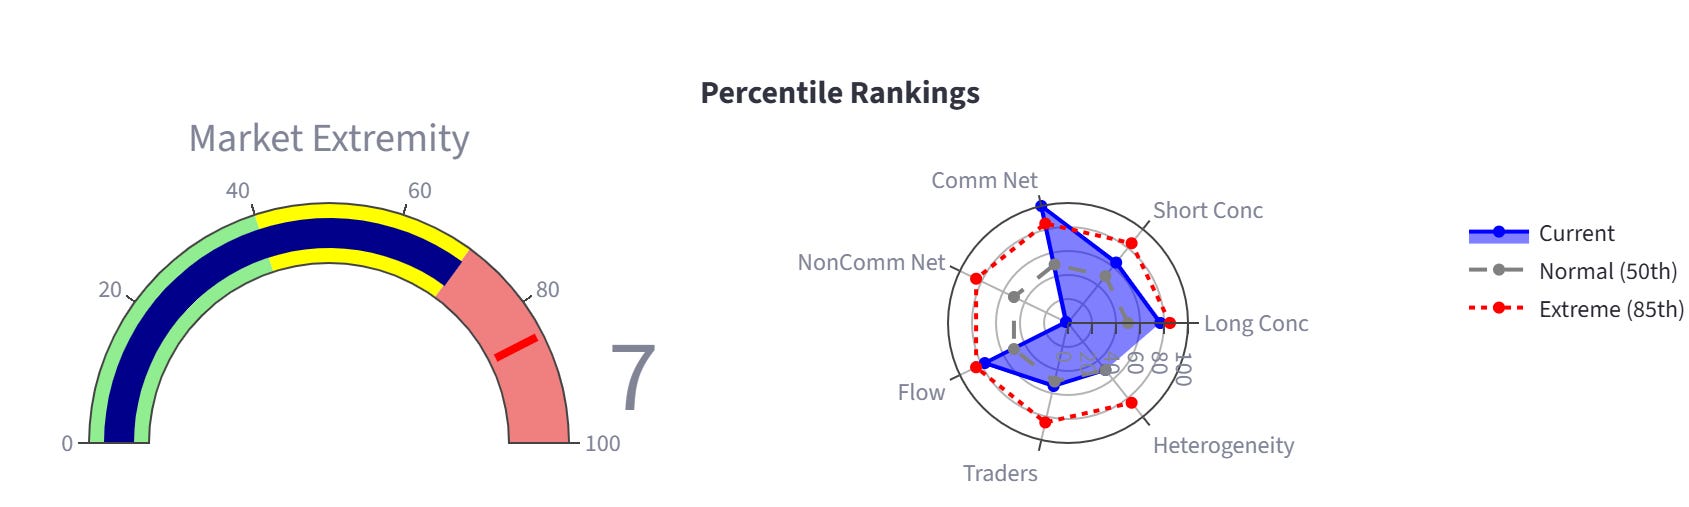
A comprehensive system that identifies distinct market states by analysing extreme readings across seven key dimensions of trader behaviour. This helps identify when market conditions deviate significantly from historical norms.
🟠 Commercial Long Extreme
Extremity Score 70.2 / 100
Condition: Non-commercial net <15th AND Commercial net >85th percentile
Meaning: Commercials extremely long, speculators extremely short
Risk: Potential bottom, commercials often early
Non Commercials.
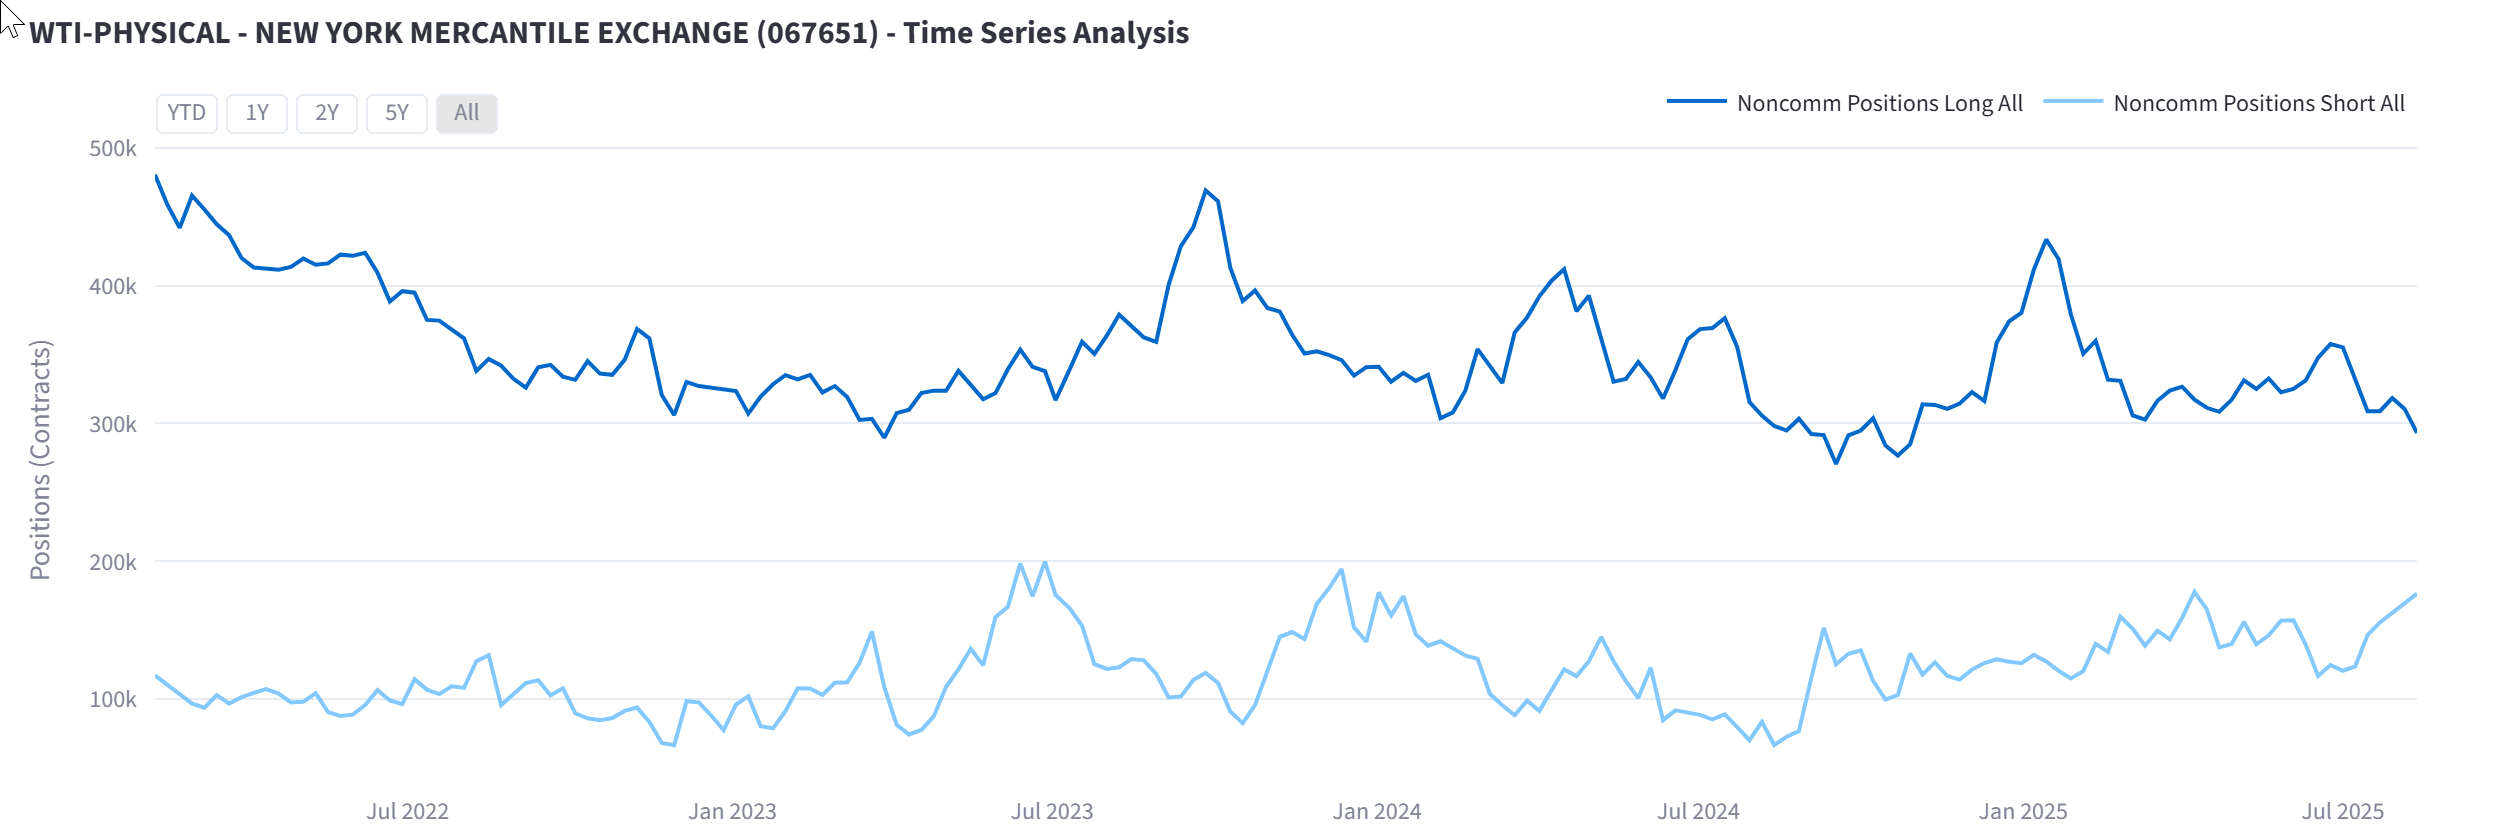
No prizes for guessing which way Non commercials are positioned. They are at 96% crowded short. At these levels, they don’t have much more available firepower to sell. Should the week have any sight of a bid over $2 dollars, there may be some rapid short covering from this cohort.
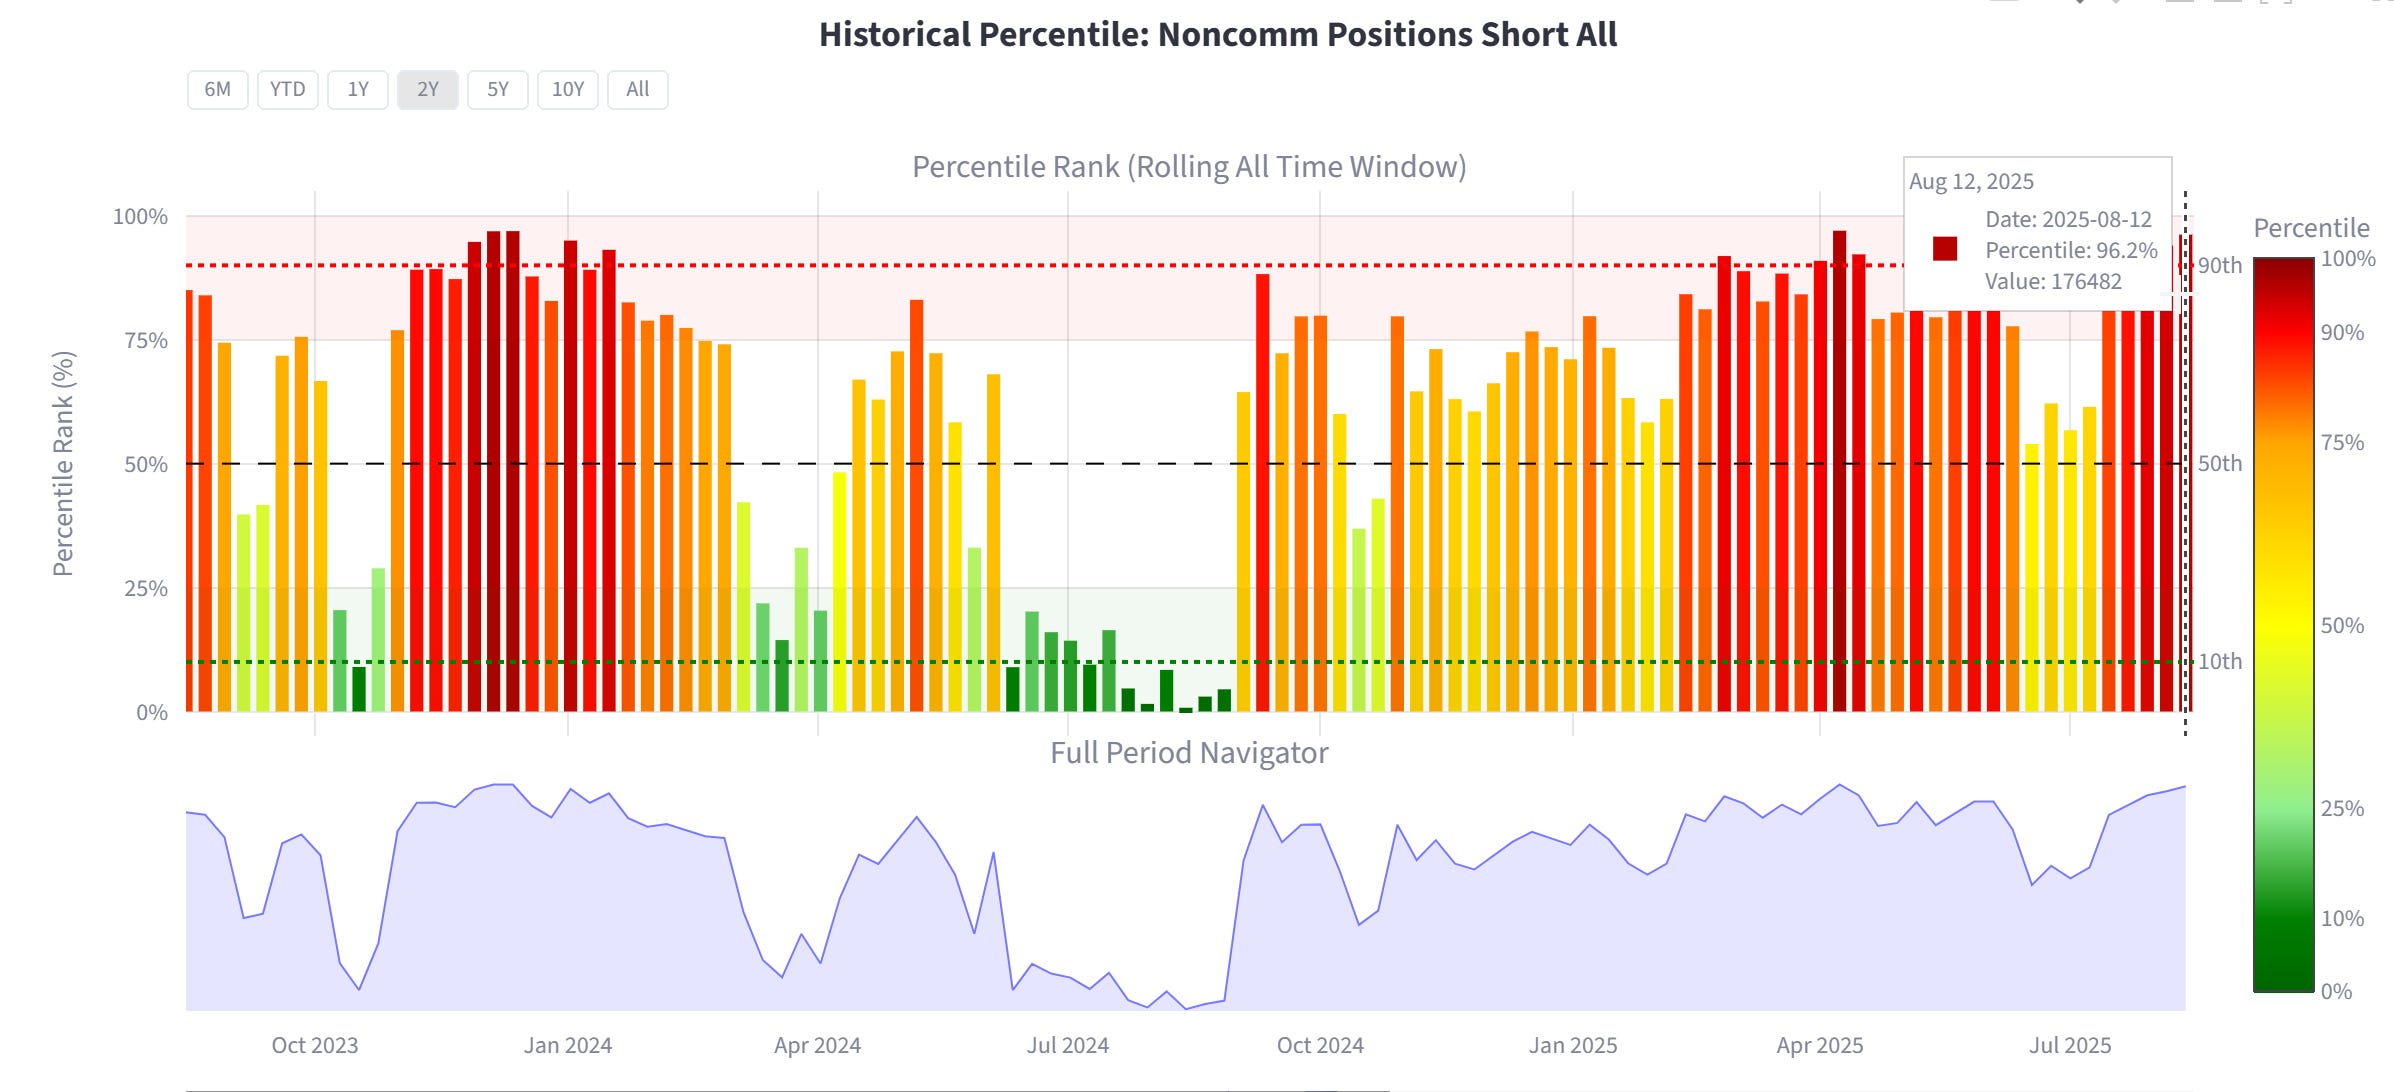
SPREADS
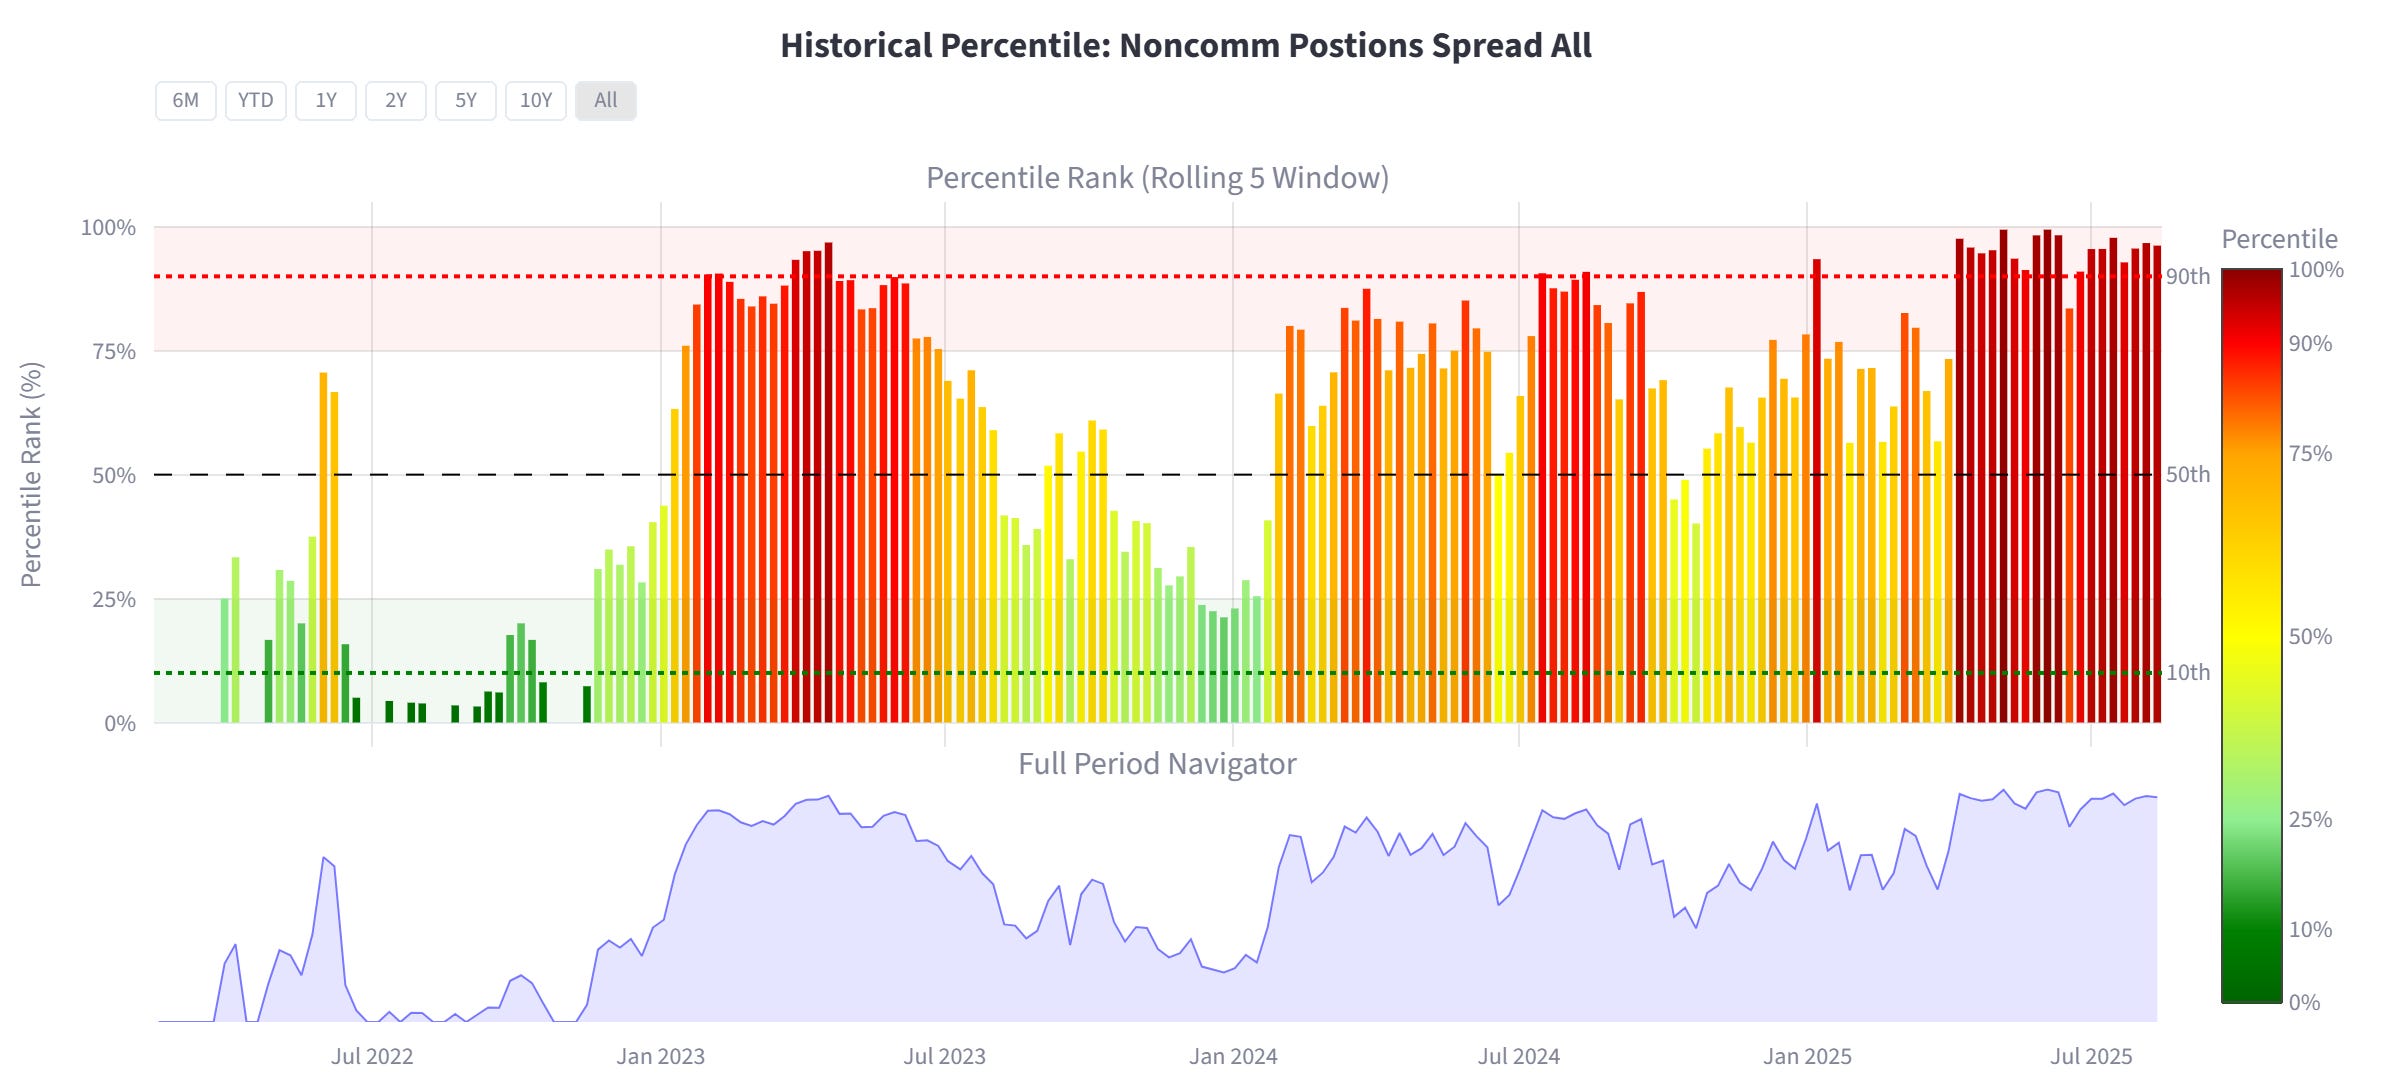
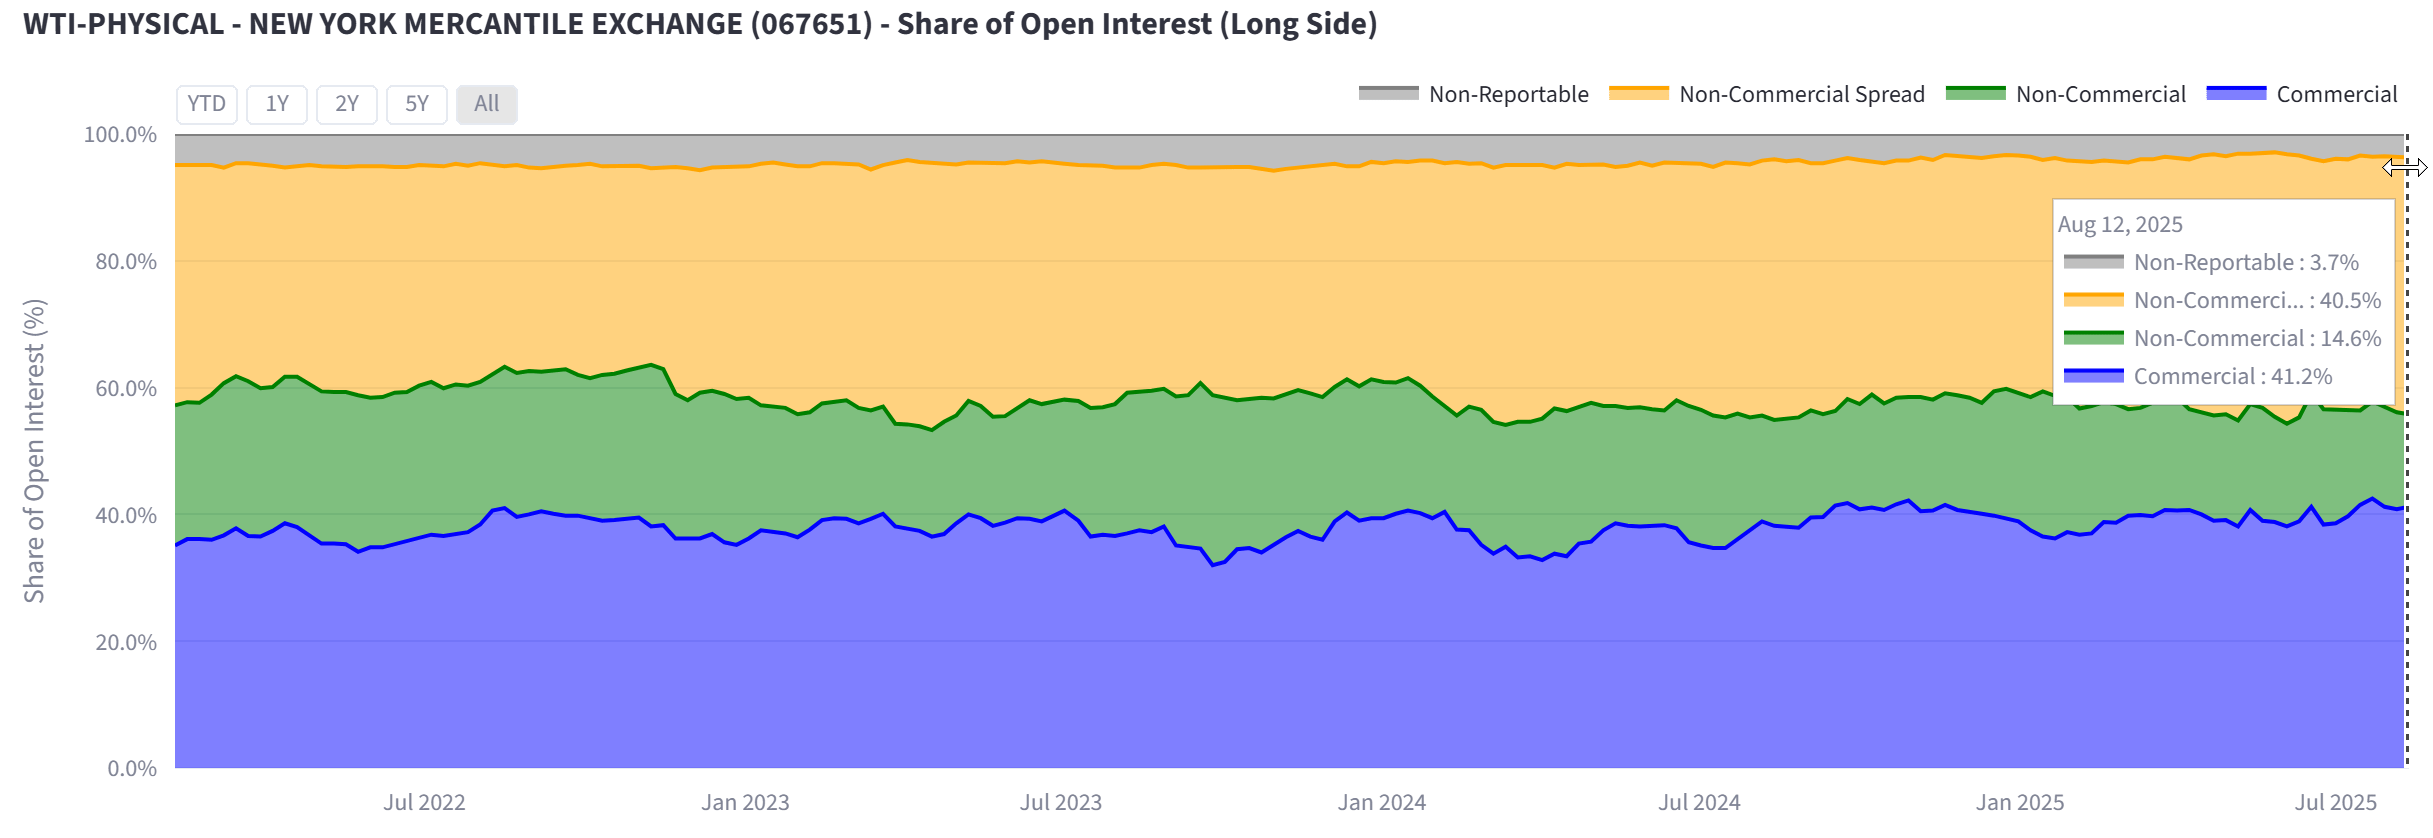
Again, packed in here at 96%. Standing room only. This is a delta neutral cohort, whereby they can typically withstand extremely large adverse directional moves. So Long/Short, it doesn’t matter to these participants. These are the nimble traders. Representing 41% of all observed WTI Oil trade positions. These levels however suggest that this cohort is also max allocated, and we can see a price snap back on light volume, which could then lead to a continuation supported with high volume.
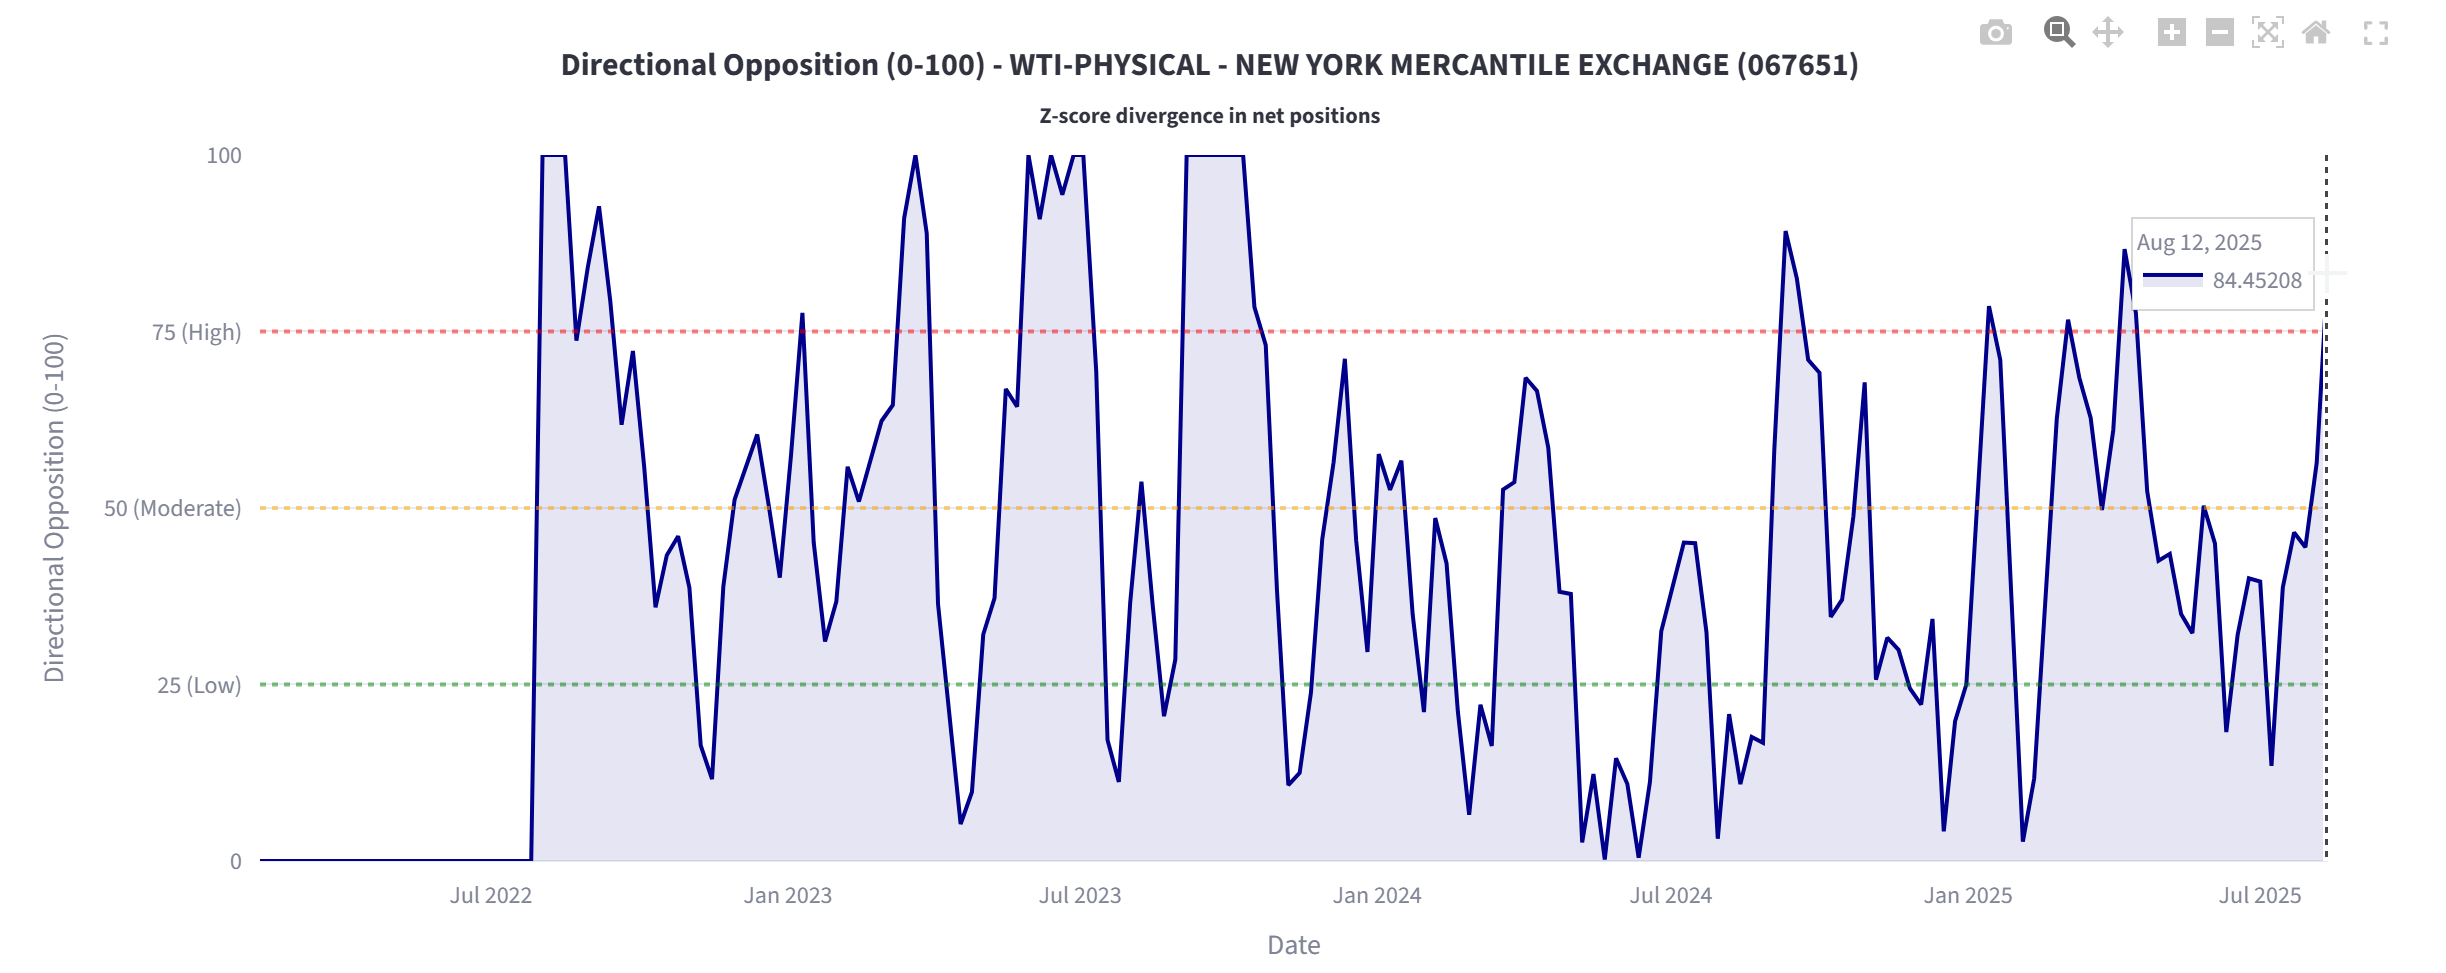
Directional opposition
This is a proprietary tool that we use to measure directional opposition, effectively to see crowding at stretched levels, utilising a Z-Score. A market can be at ‘overcrowded levels’ on but still remain in a relatively balanced trading range. This gives us an edge to alert us to points when a market is stretched.
Trade
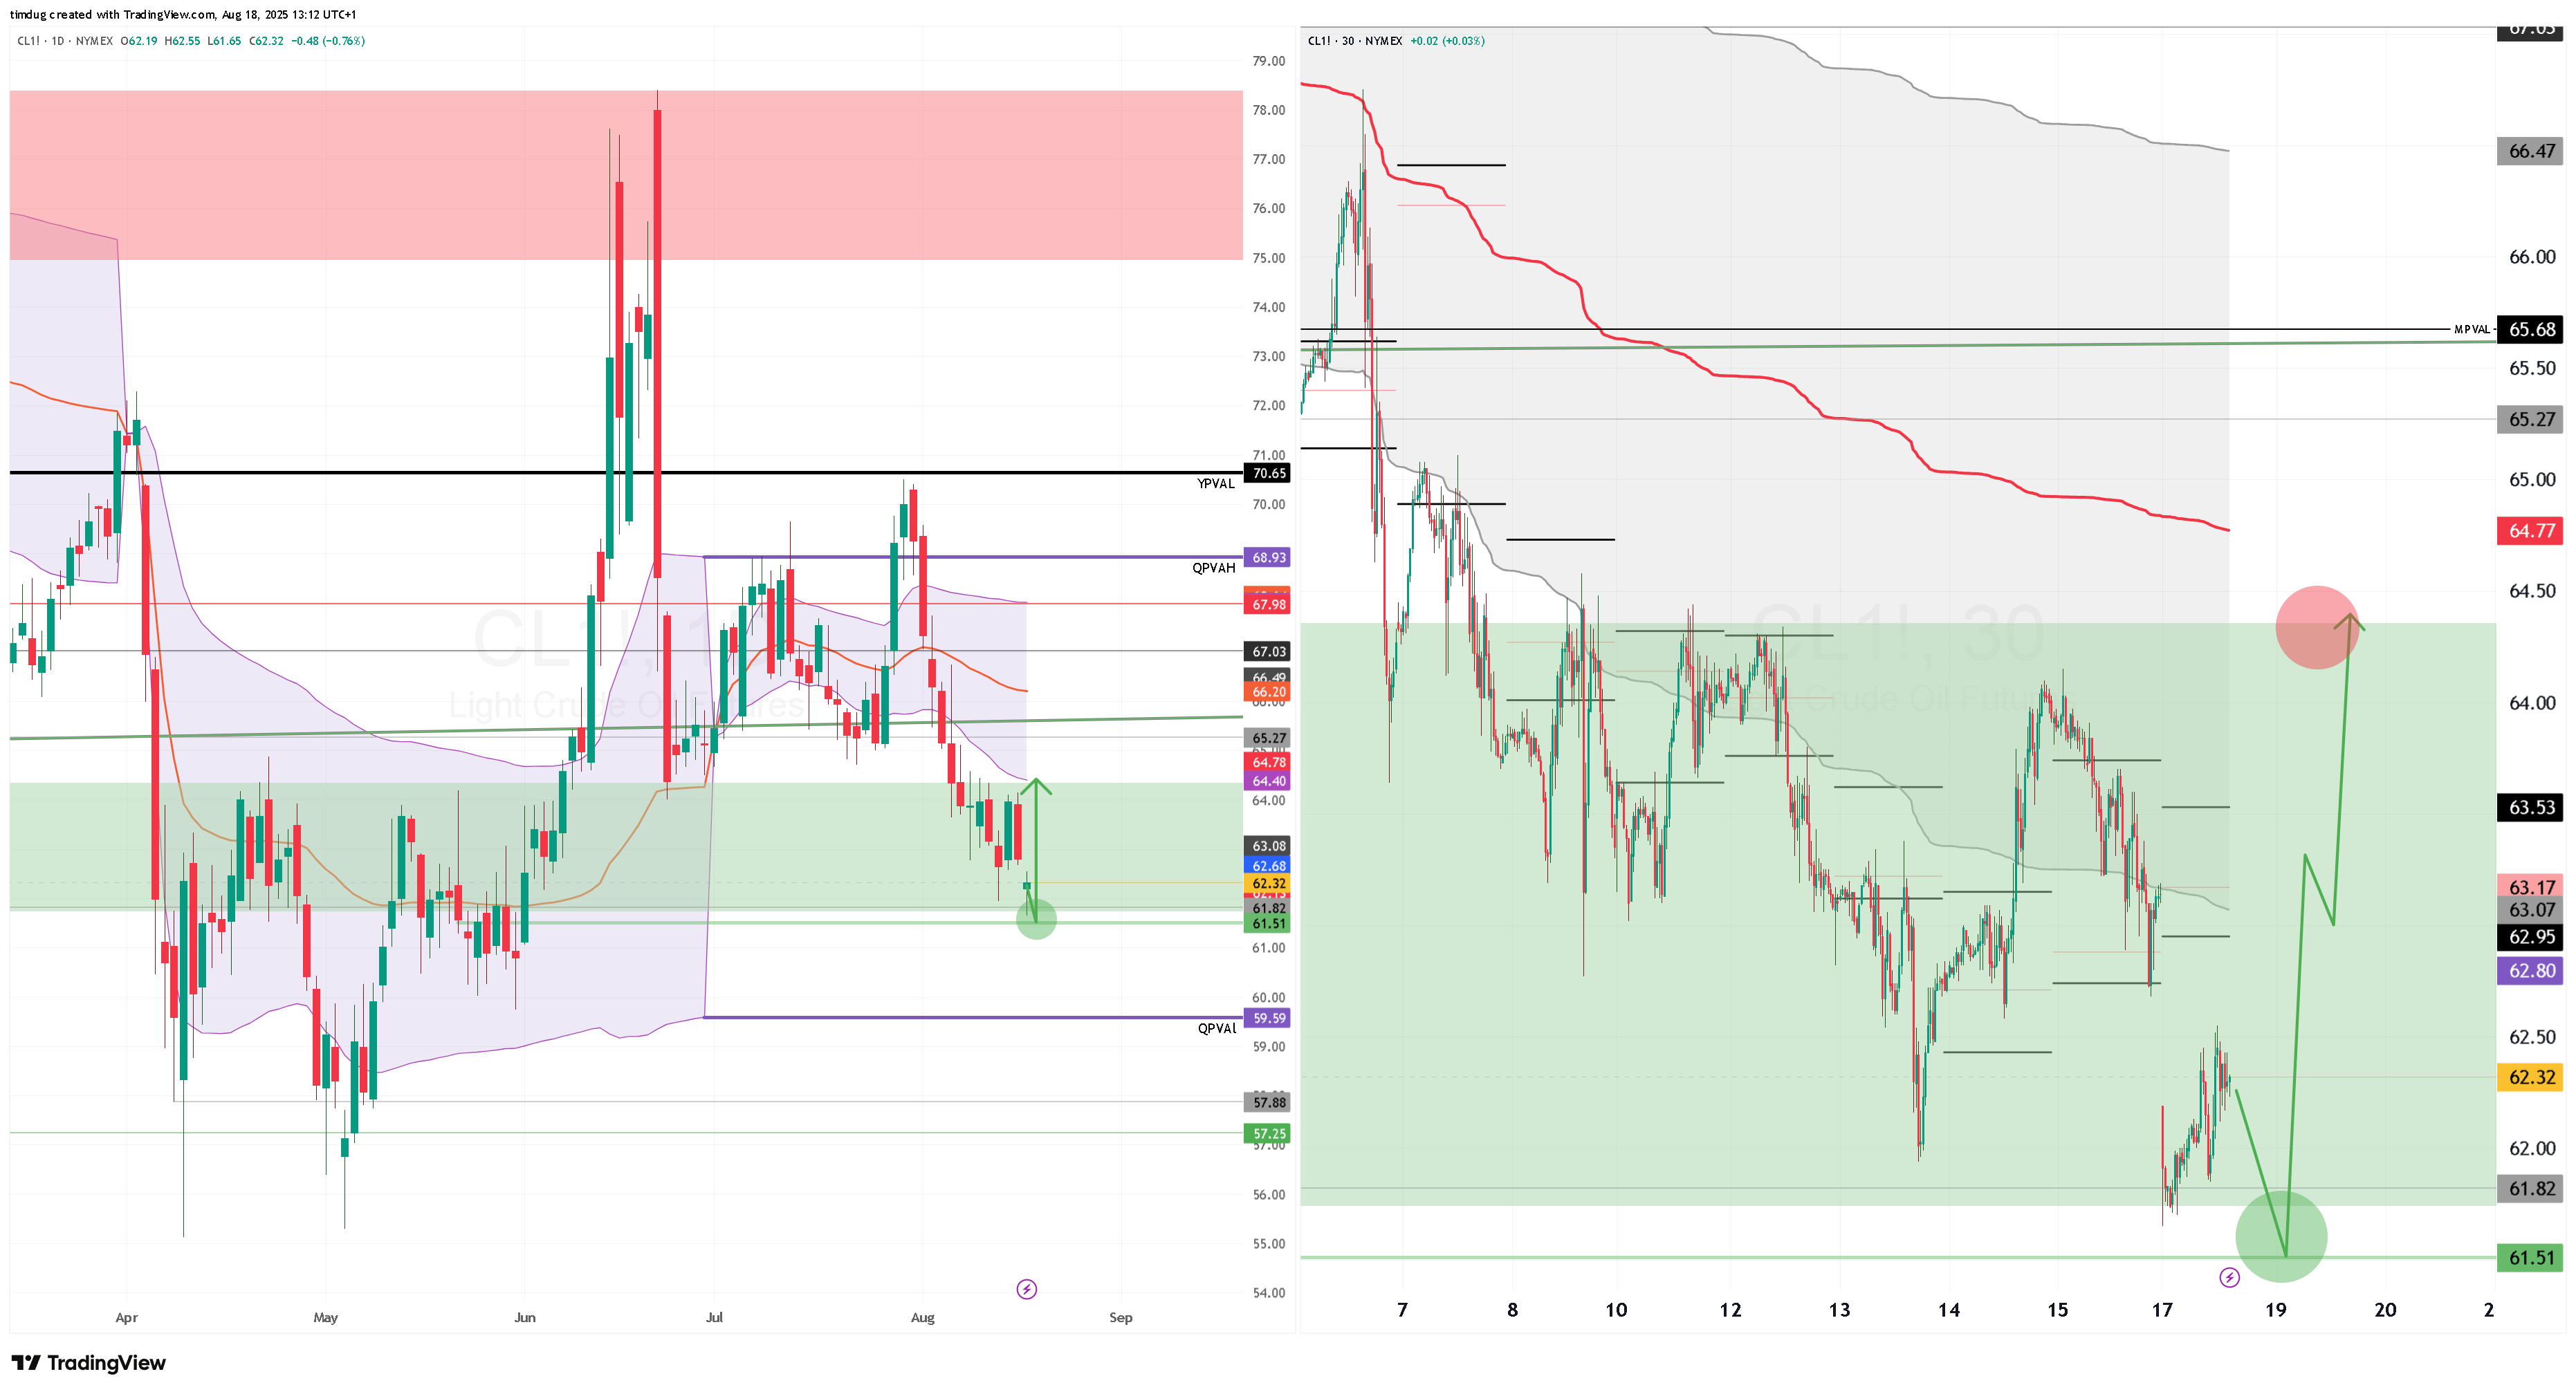
With nearly all the managed money/ non-coms positioned at max levels short, a continuation further down below the electronic session lows of approx $61.70. is technically on the cards, but on LOW volume. An attempt to make new lows may not be met with any significant trade, and we should snap back up to Q-1 $64.40.,
All this will be framed by the Trump/Zelenskyy meeting scheduled for today and the potential outcomes. I would rather be passive today on any swing or front month spread positioning unless we get strong range expansion on spreads or front month.
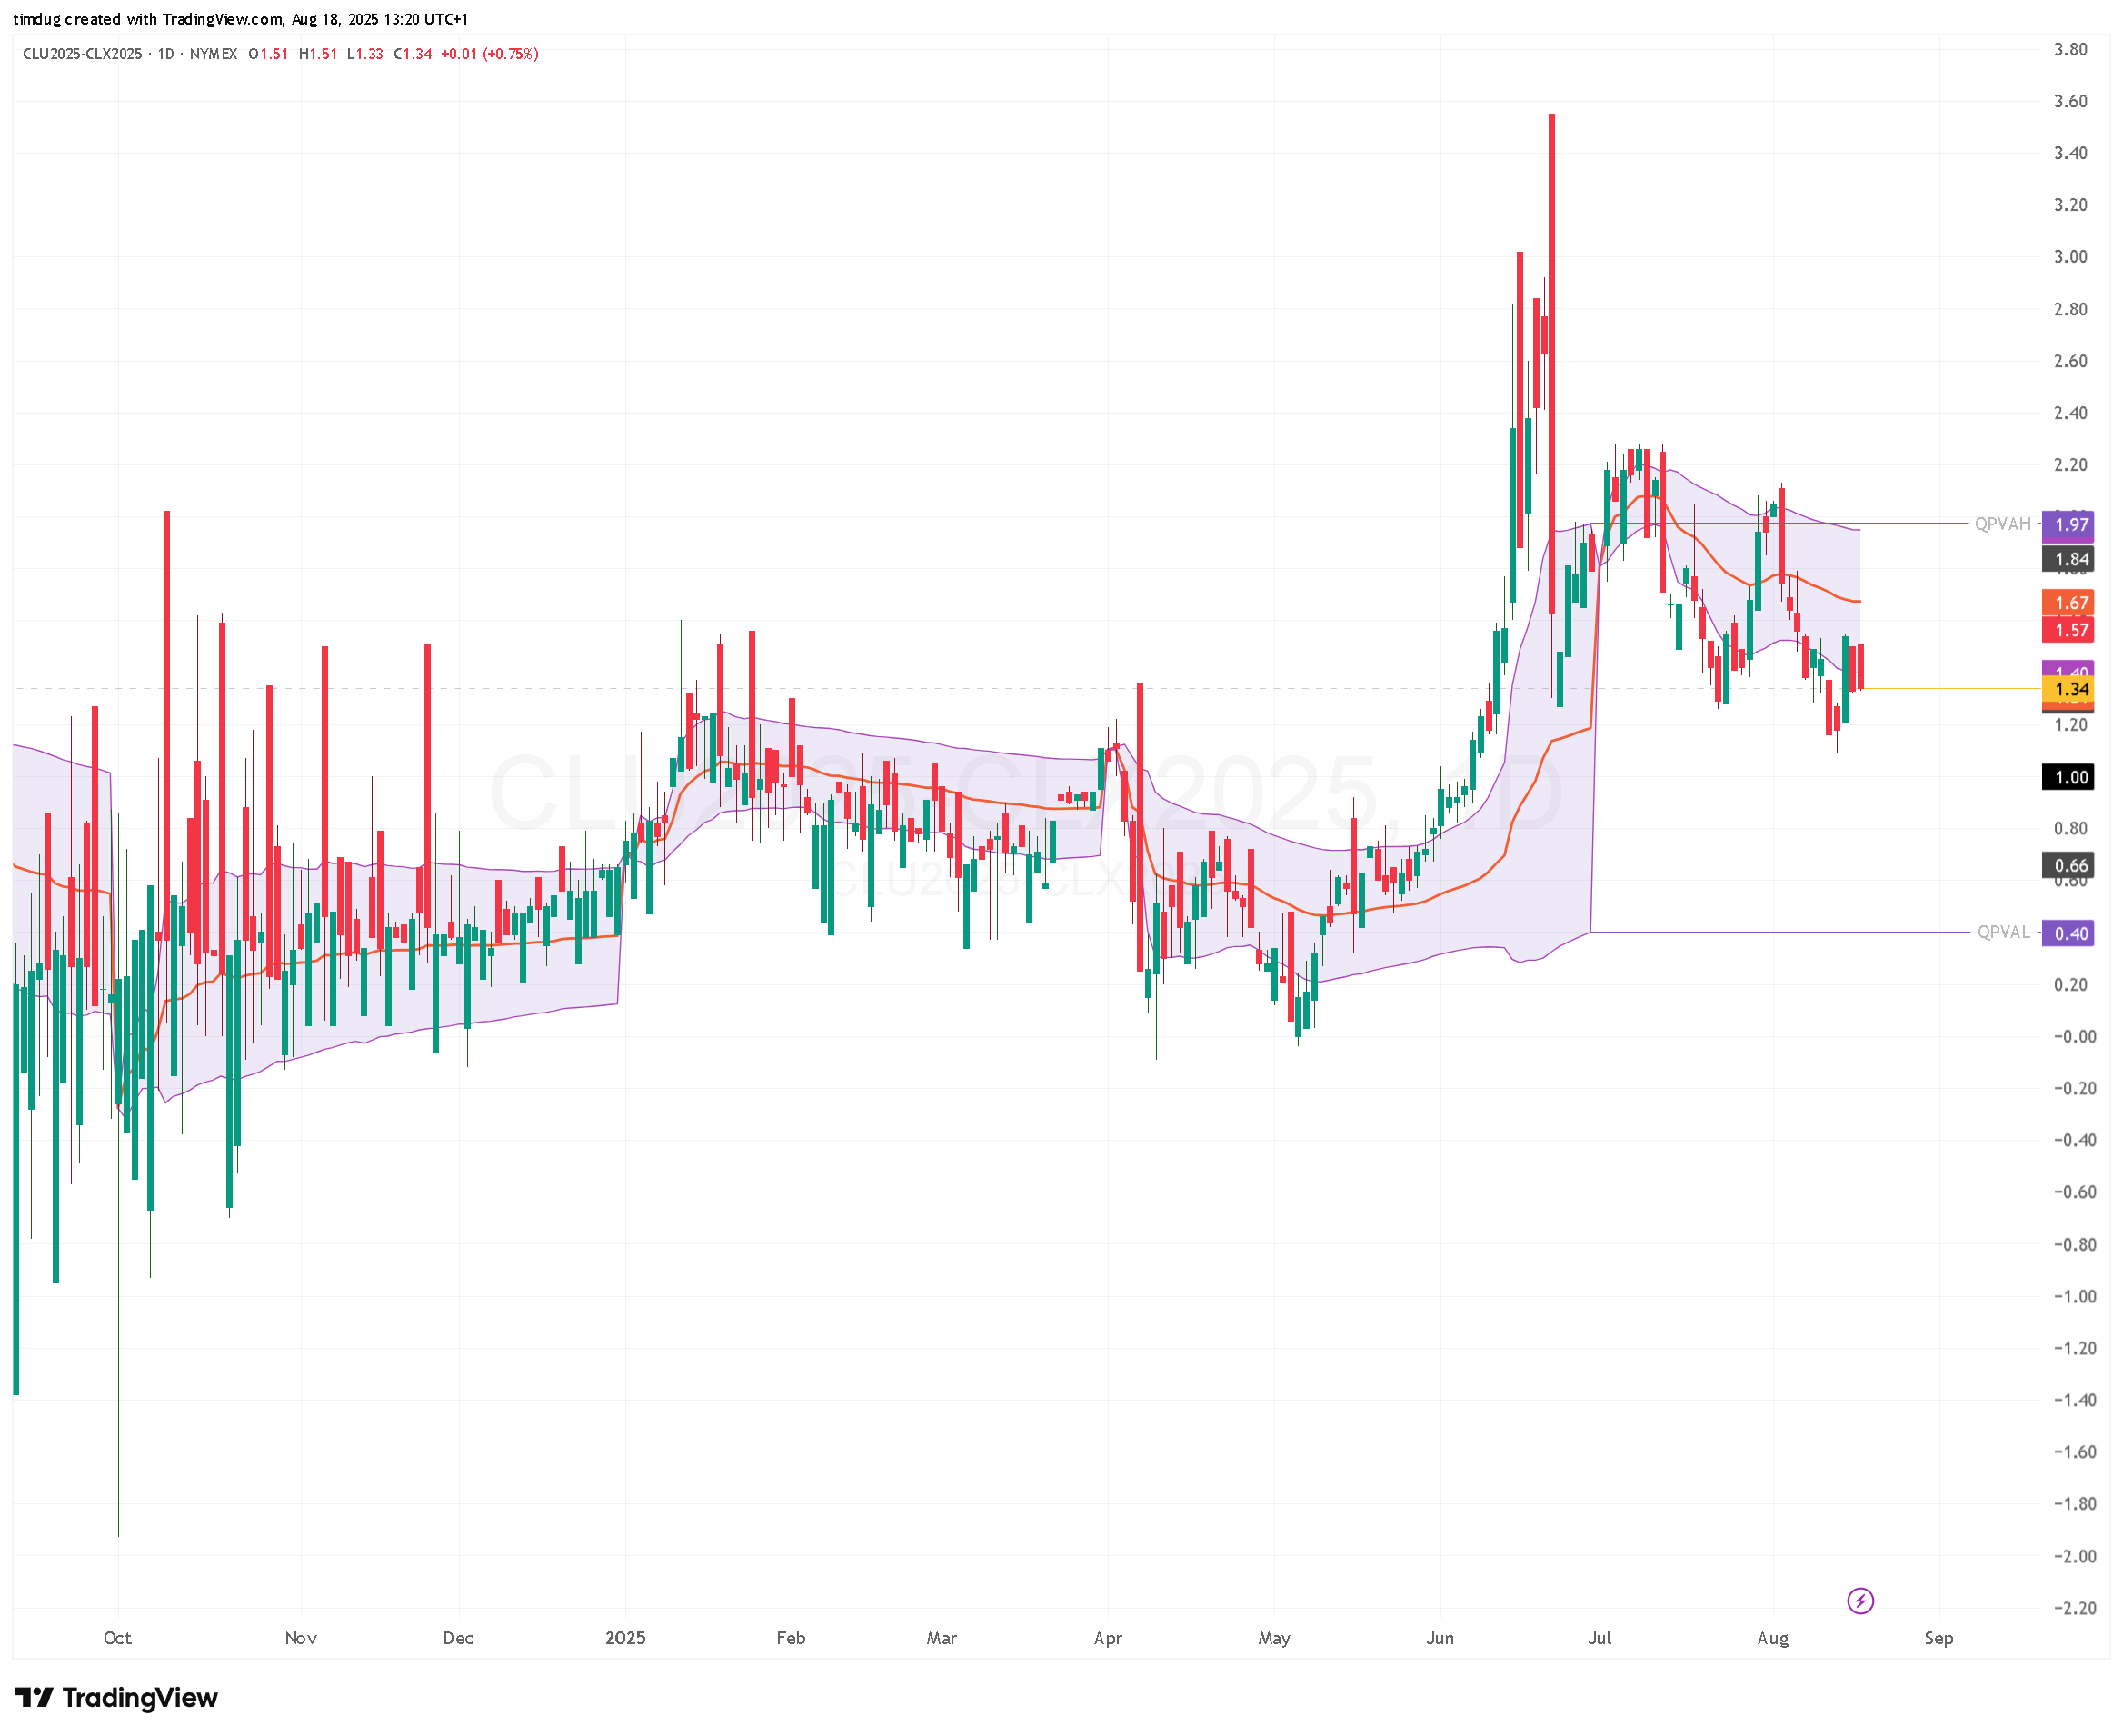
FRONT MONTH SPREAD.
The U/X spread is closing out for final day trading on the 23rd, and volumes are dropping. Volumes shifting the V/X spread now.
U/V has been a really great short op for the last 2 months as we came off best levels over Iranian risk. Most of the traders in our group have made significant % gains on their book over this. Nice work lads.
If you are interested in learning how to trade spreads on any market, or want to know more, please do reach out.
Otherwise, keep it calm out there, don’t fight the tape and have a good week. I’ll be updating with a supplemental post during the week for founder members.
Best
Tim